


All Cause Mortality in England & Wales (15 – 44y)+
Smoothed Series Exploration

A subscriber has splendidly asked if I have looked at smoothed data for this noisy series. My answer was that I have been peeking at several smoothed variants. With a fresh pot of tea to hand I decided to try and settle on an ‘ideal’ smoothed series this very morning. Herewith the result…
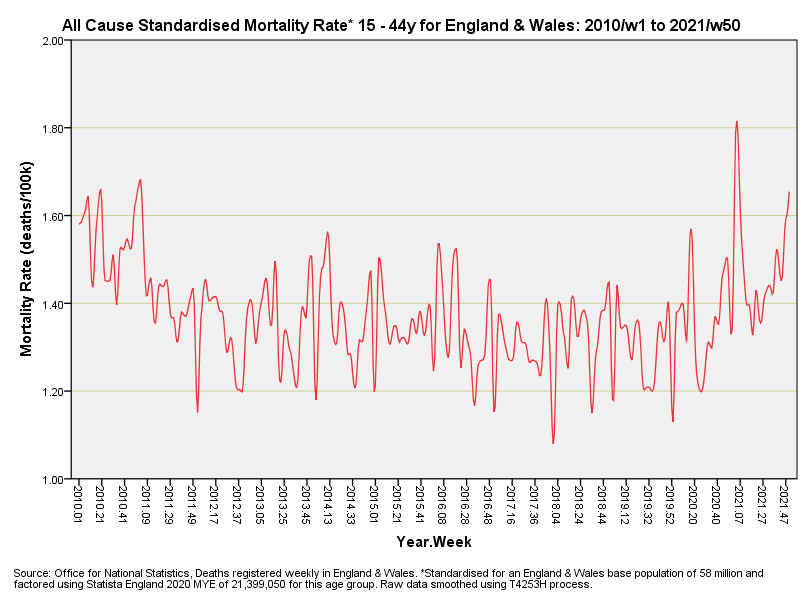
This series was generated using the T4253H smoothing process. For those not familiar the smoother starts with a running median of 4, which is centred by a running median of 2. It then re-smoothes these values by applying a running median of 5, a running median of 3, and Hanning running weighted averages (span 3). Residuals are computed by subtracting the smoothed series from the original series. This whole process is then repeated on the computed residuals. Finally, the smoothed residuals are computed by subtracting the smoothed values obtained the first time through the process. A bit of a mouthful I admit, but there is a useful summary here and here with nowt to be found on Wiki!
We can now see why t…