Assessing Causality Using Cross Correlation
Between 1st April 2020 and 30th September 2021 the UK GOV coronavirus dashboard reports a total of 6,669,985 new daily COVID cases. Over the same time frame the NHS COVID-19 Hospitals Activity COVID publication November 2021 spreadsheet reports a total of 137,547 new daily COVID admissions. By definition these 137,547 admissions must be a subset of the 6,669,985 reported cases but this does not imply causality. What I mean by this is that those 137,547 folk are going to hospital with COVID but they may not be going to hospital because of COVID.
Two data series ‘going up together’ does not guarantee causality. Two data series ‘going down together’ does not guarantee causality. One series going up as the other goes down (inverse relationship) does not imply causality. In an hour from now the local cockerel will start crowing and the sun will rise; this cockerel is not responsible for the sunrise even though the events are highly correlated.
So how can we tell if hospital admissions are being driven by daily cases in a causal manner? One way is to study the medical records of those 137,547 folk to determine their primary reason for admission; another is to resort to simulation and run data through cross correlation (CCF).
We start by assuming 100% causality; that is to say, we assume all 137,547 folk were admitted because of COVID. This infers an overall causal hospitalisation rate of 2.1% (137,547 / 6,669,985). Using this overall rate we can create a simulated causal admission series based on the new daily COVID case count, this simply being 2.1% of the count. We bracket this by assuming 0% causality; that is to say, none of the 137,547 folk were admitted because of COVID. This is achieved by taking the observed daily admissions series of 548 values and totally randomising the data.
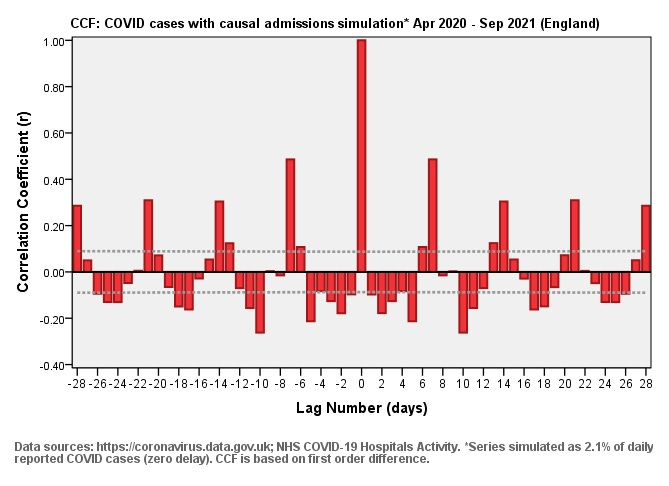
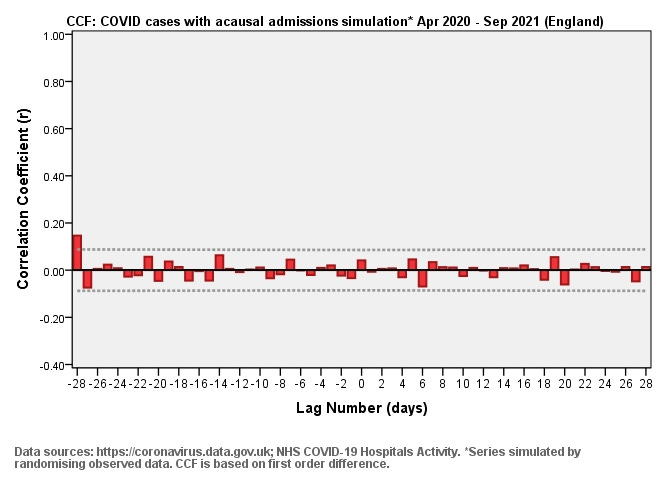
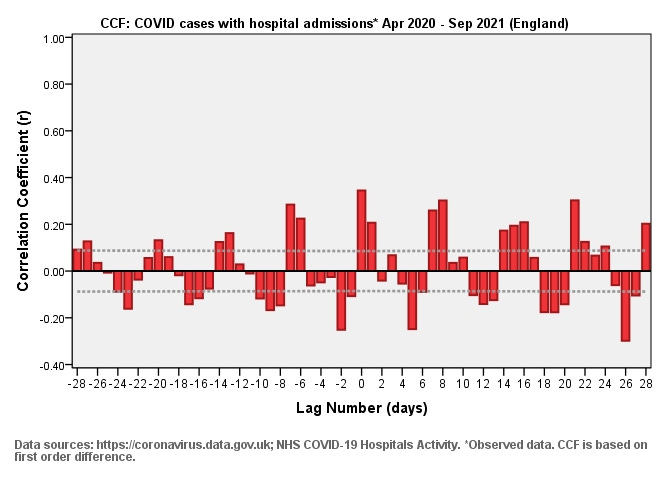
We can now run three cross correlation functions for daily new COVID cases with hospital admissions, the first being based on simulated causal admission (slide #1), the second on simulated acausal admission (slide #2), and third using the actual data (slide #3). I have kept the same scaling to enable direct visual comparison.
The first thing that should strike us in slide #1 is the whopping great bar at lag zero, reaching r = 1.00. This whopper is the hallmark of 100% genuine causality based on an admission rate of just 2.1% of reported daily cases. Some folk will ask about lags and the answer is that if I delay simulated hospitalisation by 7 days that whopper bar simply moves to lag +7. If I delay simulated hospitalisation by 14 days that whopper bar simply moves to lag +14 - this is the power and beauty of CCF! The key message to understand at this point is that if causality is operative then we are going to get sizeable bars somewhere down the line.
Now consider slide #2, for which I’ve scrambled the admissions data. We are looking at the bleak product of a fully randomised data series. There’s a bar right over at a lag -28 but that’s going to be artefact (false positive). This is what pure acausality looks like.
Now consider the real data in slide #3. Can anyone spot a whopping great bar indicating causality? Me neither! Is the series squashed between those dashed 95% confidence intervals? Nope, which means some level of cross correlation is there but not very much.
Note that the weak correlation we do observe is following the 7-day admin pattern; thus if intake has a weekly pattern and COVID testing has a weekly pattern then you are going to get cross correlation simply because of this fact. This is not evidence of causality but evidence of coincidence. If causality were a reality for hospital admissions then we’d see some pretty hefty bars at lags zero to 14 days representing incubation and onset of symptoms. Nothing of the kind is seen. Our conclusion must be that whilst 137,547 folk are going to hospital with COVID, they are not going to hospital because of COVID. We may also conclude that using hospital admission figures to understand the pandemic (and thus assess vaccine benefit) is utterly pointless.


