Autocorrelation – a forgotten tool

I have already introduced the issue of independence of measure in statistical analysis and we learned that if we ignored this critical requirement in assessment of vaccine benefit/disbenefit we could end up producing a pile of fancy-looking nonsense, and I gave an example of measuring the height of students and coming to a completely erroneous conclusion.
Be aware that august organisations like Public Health England (PHE) and the Office for National Statistics (ONS), as well as institutes and experts the world over are quite happy to ignore this critical assumption on a daily basis. I also sometimes do the same because it makes life easier and enables me to jump to exciting conclusions I rather fancy. The difference is that being retired I’m in a position to blab whereas employed statisticians need to hold down a job. There is a very nice summary of autocorrelation on Wiki (link below) and I suggest members digest this.
Autocorrelation is an elegant tool for detecting patterns in data. If our data are sizes of eggs packed in a crate then autocorrelation will detect patterns occurring during the packing process – some packers might pack those eggs randomly whilst others might go for the biggest first, and yet others might pack the smallest first leaving the biggest to go on top thus fooling the merchant. Autocorrelation will reveal anything underhand!
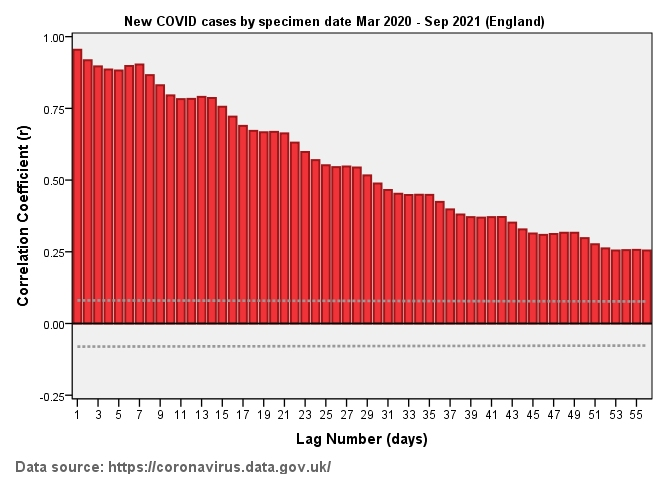
However, if our data are measures of something occurring every day (like COVID cases) then autocorrelation will detect patterns developing over time. Again, autocorrelation will reveal anything underhand; it will also reveal stuff that is darn useful to know. Let us have a look at COVID cases per day across England for the period 1st March 2020 – 30th September 2021 using official UK GOV data embedded in the variable newCasesBySpecimenDate. As the name suggests this is a daily count of newly identified COVID cases (though in actuality these are merely positive test results and not medical cases proper) based upon the date of the earliest swab specimen that tested positive.
Here is our palisade of positive values again that reveal the number of cases we are likely to observe today (lag zero) is pretty much what we observed yesterday (lag 1) and the day before that (lag 2), and so on (slide #1). We see a high degree of serial correlation, with values starting up at r = 0.954 for lag 1 and ending up at r = 0.255 for lag 56. We called this ‘momentum’ but we could also call it ‘memory’, technically speaking we should call it ‘dependency’ and it is precisely what we should expect to see if a virus is steadily spreading through a population. It means analyses made by those who should know better are invalid if they have used techniques based on the assumption of independence of measure.
A concrete example of dependency in action is to compare COVID intake during high disease prevalence/low vaccination uptake with COVID intake during low disease prevalence/high vaccination uptake and claim vaccine benefit. We could reverse the sample periods and claim vaccine harm; this sly trick is what both entrenched camps are doing. If I were really smart I’d be writing evidence-based reports for pro-vaxxers and reports for anti-vaxxers and getting paid by both.
But this is not the whole story; there is a hidden message in this data series that autocorrelation can also squeeze out! To do that we have to remove the ‘memory’ component that is dominating matters. This is done by considering the first order differential or, in plain English, by looking at the change in COVID cases on a day-by-day basis.
When we do this we find a very regular weekly pattern hidden down in the data series (slide #2). What this means is that there is a weekly ‘pulse’ affecting the number of COVID cases. I’m pretty sure SARS-COV-2 doesn’t keep a diary so it must be something us humans are doing. Examples are a reluctance to take swabs at weekends, especially Sundays, and a concerted effort to take swabs first thing Monday morning. Whatever the mechanism the key take home message here is that we have hard evidence of COVID cases being driven by test behaviour. Those who use the phrase 'testdemic' are quite correct in their assertion.
https://en.wikipedia.org/wiki/Autocorrelation