Autocorrelation & Admissions

In the last couple of posts we’ve seen how techniques developed in the field of signal processing can reveal hidden patterns within pandemic data that are gathered on a daily basis. I’m hoping people raised an eyebrow when we discovered a hidden weekly pattern for COVID cases, for unless we can argue that the virus does the same strange periodic dance every 7 days we have to pin that pattern on the weekly testing regime.
Since dead viral fragments can linger for 90 days and trigger positive tests then we are forced to conclude it is the imposition of periodic weekly testing that is causing the patterns we are seeing. The alternative is to conclude that viral fragments (alive or dead) are phasing in and out of reality on a 7-day periodic basis. This may appeal to Trekkies.
This is not a new finding and members can thumb back to my entry dated 7/7/21 (Is Viral Testing Churning Out Random Numbers?) to discover you can predict 92.5% of the variation in COVID cases using a simple linear model based on test volume and test type alone. That’s a shocker and another piece of hard evidence supporting the notion of a testdemic.
This morning I thought we’d use the same technique to look at patterns of COVID admissions to hospital as well as patterns for existing inpatients testing positive during their stay. Again I shall utilise first order differentiated data to remove the low frequency signal generated by the slow rise and fall in numbers – we all know that the raw numbers slowly go up and down over time but we’re not interested in that, we’re interested in anything that is hidden within this rise and fall.
One way to think of this is that the tide comes in and goes out over the course of 12 hours but within those 12 hours we see many smaller waves. Those smaller waves tell us about conditions at sea; in effect I’m trying to understand the ‘sea state’ of the pandemic using a tool designed for identifying periodic patterns in data.
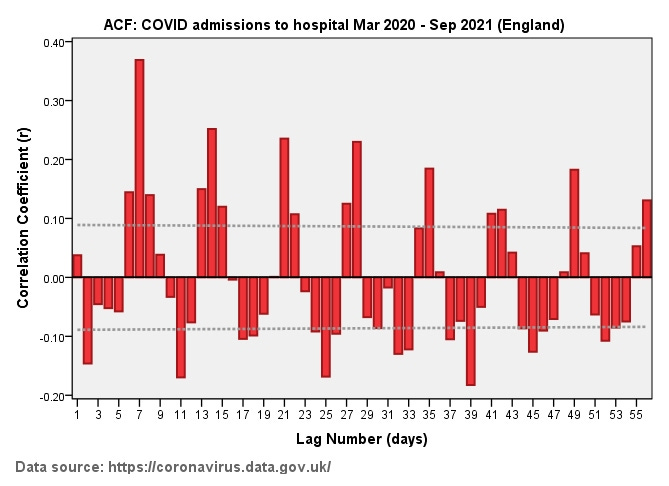
Here is our first slide and we can see yet another of those tell-tale 7-day periodic signals underlying COVID admissions to hospital. This is telling us that COVID cases are not rushed to hospital as soon as they get ill enough but some form of weekly administrative function is causing numbers to come in like waves crashing on the shore. This could be a reluctance to admit COVID cases at weekends followed by a sudden splurge on Mondays or a last minute rush on Fridays. It could also be a function of the weekly testing regime that is pulsing numbers just like the wind pulses the waves into being. Whatever the mechanism we are certainly not looking at the critical situation that folk are imagining after watching the news and hearing experts; a genuinely critical situation would induce aperiodic chaos and what we're seeing here are the signs of something that is managed/planned.
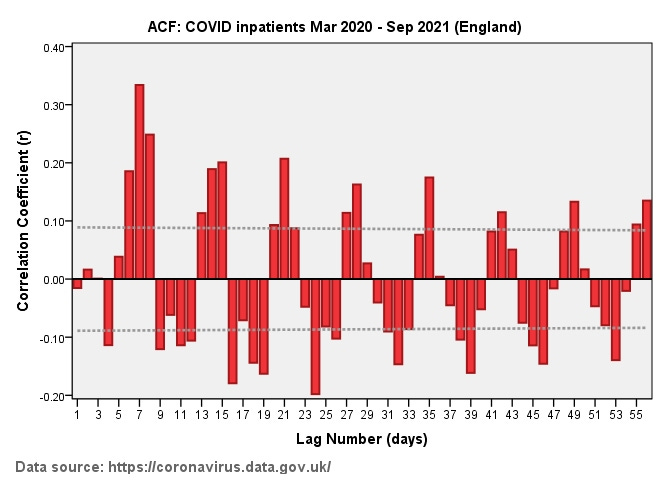
In the second slide we find the same strange situation applies to all those who were lying in hospital waiting for treatment for any condition whatsoever who also happened to test positive during their stay. Either the virus does the merry phasing of reality dance around the wards in 7-time or nurses are testing patients according to a weekly protocol that then generates the cases we see. We can’t blame the weekly admissions tango for this since everyone is already in bed eating grapes and reading pulp fiction. What we can blame – and this is where Occam would surely agree – is a testing regime that generates the illusion of a pandemic.