
Calibrating COVID (part 1)
Using a neural network to assess diagnostic reliability of the PCR test for in-hospital death

I am going to assume that subscribers to this newsletter are pretty much aware of the extraordinarily bizarre situation we find ourselves in when it comes to diagnostic methods adopted for COVID-19. A person with no symptoms other than joy and happiness can poke themselves up the nose at home and claim SARS-COV-2 infection because a plastic device says so. When we come to question the reliability of that device and ask for performance data revealing specificity and sensitivity we are branded as anti-vaxxers. Hospitals are no better places for a poke either - I’ve had several nurses confide that they test unvaccinated admissions relentlessly until they get a positive test result. The word is BIAS, though I am tempted to use stronger.
So here I am, sitting on anonymised electronic patient records for 11,156 in-hospital deaths over the period 1st Feb - 7th Dec 2020 for an undisclosed NHS trust wondering if there’s a way of assessing the reliability of COVID designation using information contained within ten diagnostic fields plus a few demographics. I hit upon the idea of using Multilayer Perception (MLP) - a feedforward artificial neural network technique to model incidence of COVID death using a wide variety of diseases and conditions along with age, gender and case complexity (total diagnoses per record).
To account for the key dynamics of the pandemic each dated death record was also tagged with the number of pillar 1 + 2 tests, new daily COVID cases declared, disease prevalence1 and daily certified COVID deaths for England occurring on that same day. Crude indeed, but these should absorb some of the seasonal and wave-like variation.
The full listing of variables available for MLP was as follows:-
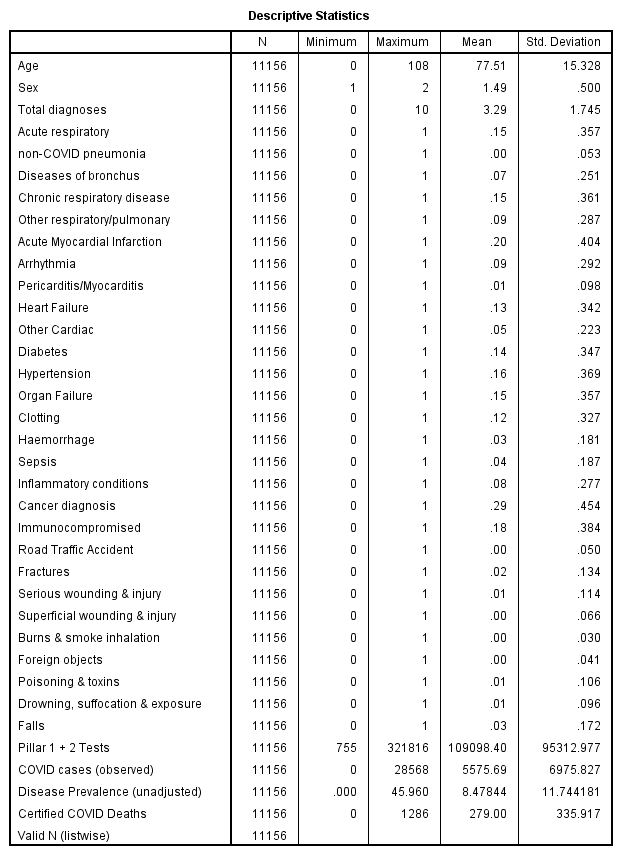
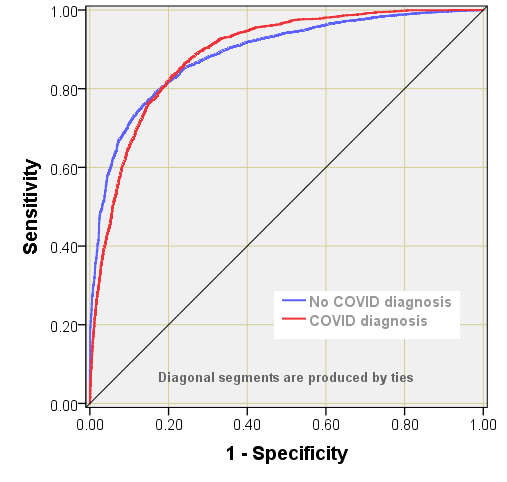
MLP was run with randomised selection of 69.7% of cases for training (7,779) and 30.3% of cases for testing (3,377). Cross entropy error for training was 5159.4 with 12.5% incorrect predictions, with cross entropy error for testing at 928.6 with 12.2% incorrect predictions. The Receiver Operating Characteristic (ROC curve) returned a rather pleasing 0.889 for presence of a COVID diagnosis as well as absence. This is an excellent result, with a predictive performance far better than expected that lends confidence to the next stage…
…the next stage being to crosstabulate MLP predicted COVID status with observed COVID status:-
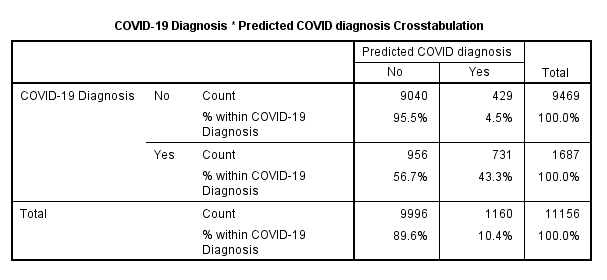
We note that just 731 / 1687 (43.3%) of observed COVID diagnoses were also predicted as COVID positive by the MLP model, though there is much better agreement amongst negative test results (95.5%). Overall we find 9,771 / 11,156 (87.6%) agreement when summed over negative and positive test results. The real interest, however, sure perks up when we crosstabulate audited COVID status against those 9,771 agreeable cases…
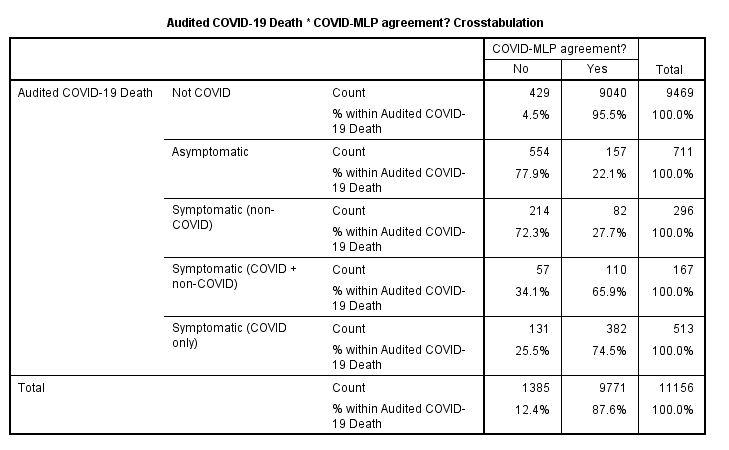
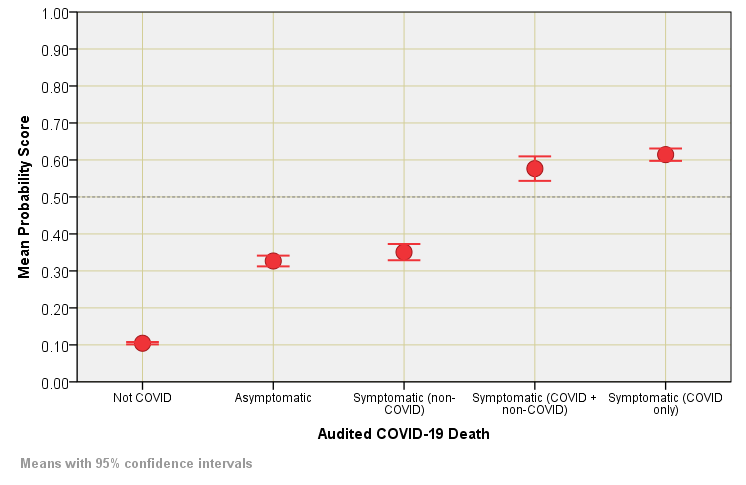
When it comes to symptomatic COVID without the complication of other respiratory conditions (e.g. asthma, COPD) then we find 74.5% total agreement between the MLP model and COVID designation, this dropping to just 22.1% for COVID designated death without respiratory complication of any kind. One last thing we can do before we get that kettle on is to plot out mean MLP scores of the probability for COVID designation against audited status so we may see this result in a visual manner…
Obviously all will depend on the MLP model performance and a more sophisticated medical model will no doubt push agreements further and raise scores. Nevertheless, we now at least have a feel for the relative reliability of the PCR test in the diagnosis of hospital admissions ending in death over the period 1st Feb - 7th Dec 2020 for the NHS Trust under study.
Whilst the kettle is boiling we could adopt a crude odds ratio approach and reveal a mean score of 0.614 for symptomatic (COVID only) compared to 0.327 for asymptomatic as state that asymptomatic designation is 1.88 times more likely to end in clinical nonsense than cases at the sharp end. This, of course, assumes that COVID-19 is primarily a respiratory disease: this muddy issue was partly addressed in COVID Uncovered (part 4) where factor analysis more or less isolated COVID-19 and acute respiratory conditions. I am tempted to turn the handle on some staged multivariate logistic regression to investigate further.
COVID cases per 100 people tested - a figure I derived from NHS Test & Trace data.
I can see that I am going to have to get back into Neural Networks ! do you know of any good Python implementations of MLP? I can't afford SPSS