Mortality Impact 1975 – 2021 (part 2)
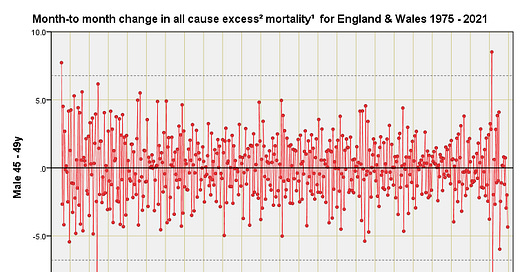
England & Wales differential monthly excess mortality by quinary age band & sex: males 45+y
For an explanation of these charts please refer to part 1 of this series. I’m not going to comment under each slide for they should be self-explanatory and the situation clear (and somewhat repetitive). The 2020 ‘pandemic’ shows up during Apr 2020 when the NHS was thrown into managerial chaos and old folk were shunted into care homes, and again during Jan 2021 when vaccine roll-out was in progress. During all other months it was pretty much death as usual. Quite why the impact of a novel, deadly virus has been restricted to just two months is beyond me unless, of course, that it wasn’t so novel and not so deadly with other factors also driving the body count. In this series of slides we also observe historic outbreaks of something nasty that match or exceed anything SARS-COV-2 can offer in terms of virulence, transmissibility and potency. This particularly holds true for the older generations whose excess mortality rocketed during 1975, 1976 and 1989. What is novel here is not the dis…


