
COVID uncovered (part 6)
Development of a case severity index score using bed occupancy data

Back in parts 1 - 5 of this series I squeezed some juice out of an anonymised data dump I had been given for emergency department admissions and in-hospital deaths for an undisclosed NHS Trust. This dump covered the period up to Sep ’21 and so I decided to return to the UK GOV coronavirus dashboard/NHS England Hospitals Activity pages to see if I could squeeze a bit of fresher juice out of these.
I hit upon two ideas, the first being to plot out COVID occupancy of mechanical ventilation (MV) beds against COVID occupancy of general beds and colour code this for each quarter period to get a handle on the overall dynamic; the second being to compare the ratio of MV bed use to general bed use for COVID and non-COVID inpatients.
First idea…

This is well funky and possibly to most colourful slide I have produced to date. During the first wave of 2020/Q2 (red blobs) we see a reasonably linear relationship between COVID MV bed occupancy and COVID general bed occupancy, as we may expect. 2020/Q3 (orange blobs) are tucked right into the bottom left-hand corner during the summer of glorious sunshine and few cases: we may note how this series is an extension of the previous quarter. 2020/Q4 (yellow blobs) starts out in a similar fashion but veers off to the right indicating an influx of less severe cases. The march of pale green blobs for 2021/Q1 indicates a swing between ‘standard’ severe and less severe COVID influx until occupancy settles back down. The first few data points for the current quarter of 2022/Q1 are rather interesting in that they indicate an influx of particularly mild COVID cases.
Second idea…
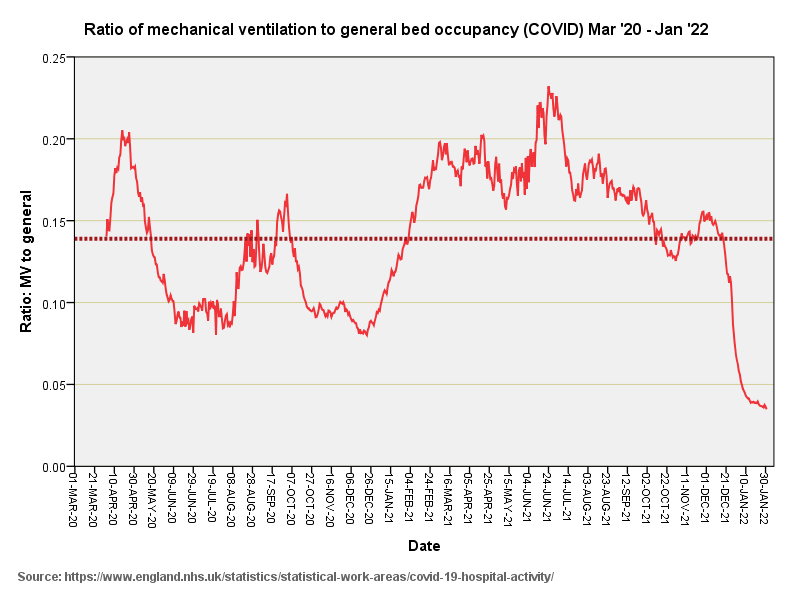
Here’s the same data again but revealed as a time series of the ratio of mechanical bed occupancy to general bed occupancy for COVID inpatients over the period Mar ’20 – Jan ’22. We may think of this as a handy proxy for case severity, so I shall call the series the ‘case severity index’ (CSI). The curious thing here is that the CSI reaches its peak during June 2021 at a time when the seasonal infection peak of winter 2020/21 had long gone. This prompted me to run a quick Pearson correlation for CSI vs. the official daily count of COVID cases for England (newCasesBySpecimenDate), which fetched-up at r = -0.386 (p<0.001, n=670). It was somewhat surprising to see a negative coefficient so I plotted both series out on a dual axis chart…
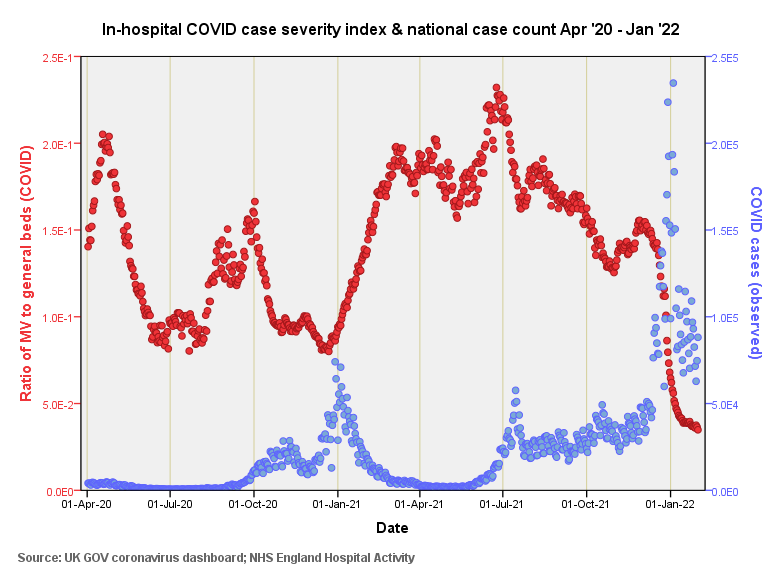
There we go! It’s tricky to neatly align both series along the y-axis due to the impressive case counts during winter 2021/22, though we may see that this stonking outbreak coincides with the lowest CSI derived to date. We may also note the blue hump back in winter 2020/21 aligns with another significant dip in CSI. What we have here – make no mistake - is an inverse relationship between COVID case severity and COVID case count.
CSI for other diseases
A case severity index based on bed occupancy may prove to be a valuable little construct, so I derived the ratio of MV bed occupancy to general bed occupancy for non-COVID inpatients over the same period to get a feel for what else may have been going on…
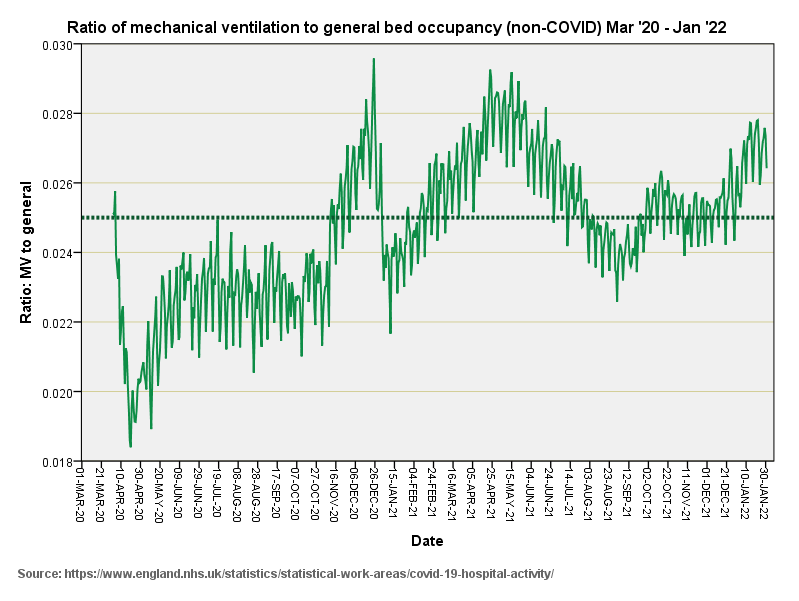
We observe a sharp peak for Dec ’20 then a gradual build to another peak in Apr-May ’21. This is very curious situation indeed and ideally we’d speak to a few registrars to get a handle on elevated MV bed use for non-COVID patients. Why would incidence of (non-COVID) severe respiratory illness increase as spring got underway? Is this a vaccine thing or something else? We may note a general upward trend over this period that may well result from changes to MV bed management protocols giving greater weight to non-COVID cases as the pandemic declines.
In this next dual axis slide I combine both indices so we may discern any relationship between trends in COVID and non-COVID case severity. Firstly, we should note the scaling difference for the y-axes, which hits a ratio of 0.25 for COVID as opposed to just 0.030 for non-COVID, this giving us a feel for relative severity1…
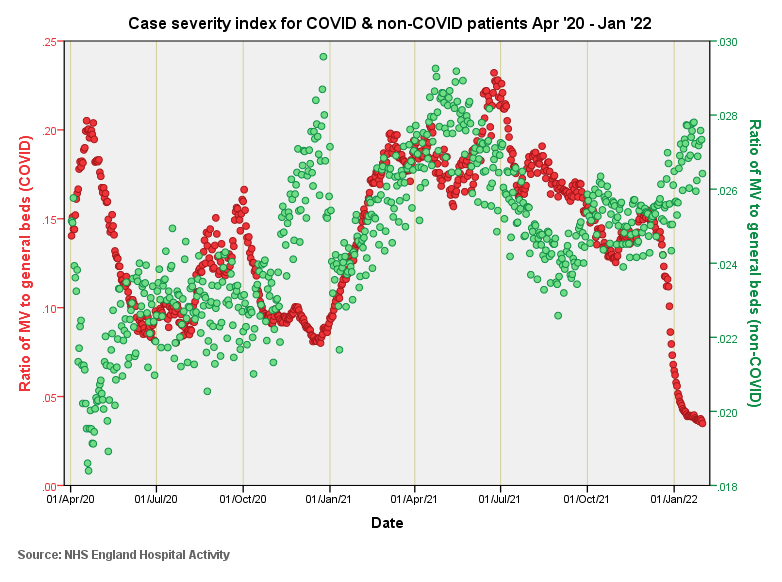
I note a striking inverse relationship for the first wave during Apr ‘20 that suggests non-COVID cases got the brunt end of the case management deal when it came to MV beds. The situation flips during the winter of 2020/21 when MV beds were preferentially used for non-COVID respiratory cases, this is most interesting indeed!
Also intriguing is the elevated CSI for both COVID and non-COVID respiratory cases during spring and early summer of 2021. This would suggest this was not just a COVID thing but something more generic. Adverse reactions to the vaccines once again may hold the answer but the situation is far from being clear cut. What is particularly curious is the recent sharp decline in the CSI for COVID cases at a time when non-COVID CSI is once again in the ascendant. Declines as well-defined as this get me thinking about policy changes as well as changes in clinical coding.
Kettle on!
Though do take care here because non-COVID cases will include bed use for very minor procedures and people who are generally in good health.