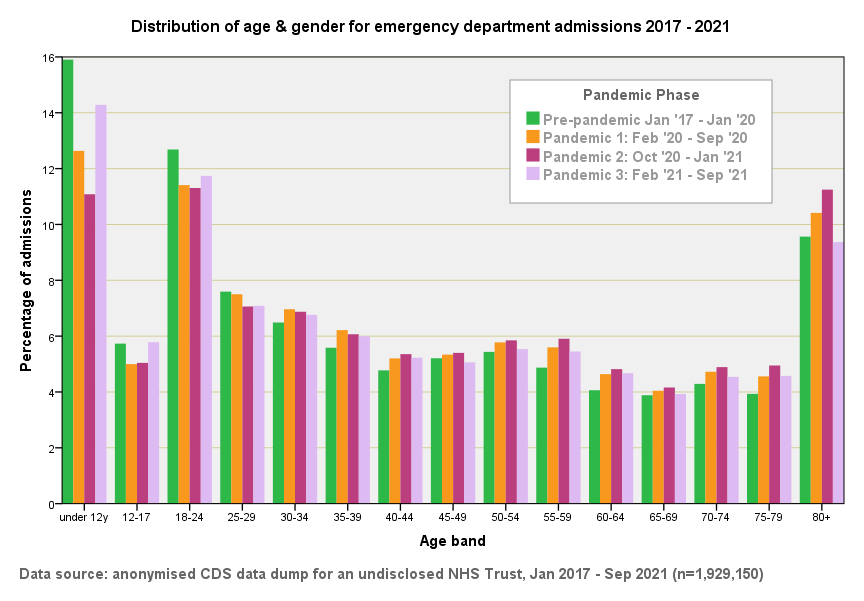
With facebook folk very sensibly asking if the age profile of emergency department admissions has changed between pre and post pandemic periods I thought I’d let my tea brew a little longer and produce this pleasing plot. I’ve flipped the y-axis (vertical) from raw counts to percentages to permit comparisons across pandemic phases. The greatest changes are seen with the under 12 year group. Note how the pandemic phase 3 percentages kick back up for the under 12y, 12-17y and 18-24y categories but not for any other age group. The marked progression and decline in the 80+y category is also interesting and is likely to be partly a result of survival bias.
© 2025 John Dee
Substack is the home for great culture


