Emergency Department Admissions: Analysis of ECDS Dataset (part 3)
Further analysis of an ECDS data dump of 237k adult admissions records to the emergency departments of an undisclosed UK NHS Trust: COVID arrival mode & discharge
Today I am going to pursue the COVID question further by looking at arrival mode & discharge using the new, improved, whiter-than-white ECDS dataset. Here’s arrival mode in the raw, cross-tabulated by its re-coded form:
If we get out hand-held trusty calculators out we shall discover, as we discovered with the CDS 010 dataset, that the vast majority of admissions to the emergency department are not by ambulance of some sort (71.4%). If I do the same raw vs. re-coded trick with discharge destination we get this table:
Keen folk will spot the enigmatic entry that is Ambulatory ECS. This category refers to non-admitted patient care i.e. stuff done to folk whilst on the move or in the car park etc. Strictly speaking these are not ED admissions proper and sit in the twilight zone of care. So let’s get back to the COVID question…
The COVID Question (continued…)
So… there we were in 2021 with a novel and deadly virus still on the loose that either came from pangolin with pommes de terre and truffle butter or a nutty research lab with over-ripe DARPA connections. My gut favoured neither of these dishes, declaring them to be a very convenient fuction (fiction that f@cks folk up).
What was most certainly not fiction at the time was a public fearing for their lives after being bombarded by graphic images laced with plenty of flashing blue lights, oxygen masks and pleading eyes. My stepfather went around claiming they’d all soon be dead, with their only hope to be boosted with as many shots as possible. He’s now suffering from excruciating vaccine damage with one less brother, one less sister and two less close friends on his Christmas card list who decided to listen to him. I’m not so sure who are the lucky ones these days, but we don’t talk about it.
Let us then begin to examine that fuction by cross-tabulating COVID symptomatic status against the re-coded mode of arrival for ED admissions over the period January – September 2021:
Well now, there’s a surprise amongst this lot in that a slightly higher percentage of asymptomatic COVID cases arrived by ambulance (70.2%) than those suffering appropriate symptoms (64.6%). You’d think it would be the other way round but very little has made sense ever since I started analysing COVID-related data back in April 2020.
What does make some sort of sense is the lower rate (28.1%) for non-COVID cases; sensible, that, is until you realise that the likely distinguishing feature between these admissions and asymptomatic COVID admissions is a positive PCR test result rather than anything solid. Right now my guess is that such folk have scared themselves witless using a lateral flow kit at home. Nocebo, perhaps?
Here’s a similar tray bake for disposal route:
We can see an increased likelihood of hospitalisation for positive testing admissions but how much of this is driven by symptom and how much by protocol alone is impossible to say. It’s also somewhat surprising to see identical admission rates for asymptomatic and symptomatic COVID cases, which makes me extra suspicious that we’re not looking at anything genuine. My betting money - a goodly wad of it - is on this situation arising from the impact of case management protocol, with ‘cases’ improperly arising from test results instead of effectively applied genuine medicine. Treat the patient, not the disease and all that.
The Vaccination Effect
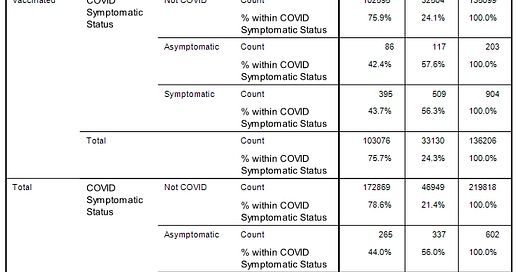
Given the ECDS dataset kicks off in January 2021 we must face the spectre of vaccine harm. When we look at tables of figures we will be looking at the distortion arising from ineffective and unsafe gene therapy. As hinted above we will also be looking at the distortion arising from the differential handling of folk. And it won’t just be positive test results inappropriately dictating matters but core belief systems of both healthcare professionals and their managers. We are talking about prejudice against the unvaccinated and an egotistical state that dictates the vaccinated can't possibly fall ill ‘coz they've had the magic juice. I guess we better take a look at some figures without further ado:
Interesting. Admission rates for vaccinated and unvaccinated symptomatic and asymptomatic COVID cases are pretty similar at around the 55.1% - 57.6% mark. What is altogether more curious is the 17.1% admission rate for unvaccinated non-COVID cases vs. the 24.1% admission rate for vaccinated non-COVID cases, which offer up a crude odds ratio of 1.41 that is not to be sniffed at if you’ll excuse the pun.
This finding has a whopping great whiff of something stinky about it, and even more so when we consider the finding revealed in Primary Clinical Outcomes For A Single Emergency Department 2017 - 2021 (part 5), this being confirmation of the ‘healthy vaccinee effect’.
In the above table we have the healthy vaccinee effect turned on its head right proper, and my betting money right now is on vaccine harm but, of course, I shall be running some tasty staged multivariate logistic regression modelling in due course to clarify matters.
The Final Frontier
So far I have dealt with those admissions over the period January – September 2021 who remained alive during their patient journey but there are a total of 263 admissions who sadly didn’t make it, either dying in the ambulance or dying in the department. I guess that most readers will want to know their COVID and vaccination status so here are a few quick-bake tables:
Thus we observe a wide age range from 21 to 100 years with a median age of 76 years. The vast majority (97.3%) did not test positive, and the vast majority (92.4%) did not suffer from a respiratory condition, with 71.1% proving to be vaccinated prior to admission. The latter figure is intriguing for, all other things being equal, we would have expected 160.5 deaths due to chance whereas 187 were observed. Classical tests of significance such as Fisher’s Exact test chalk this difference up as being highly statistically significant (p<0.001) but we must note the enormous sample size of n=223,487 and modest crude odds ratio of 1.17 and thus point our accusatory finger with caution.
Kettle On!