Estimating Daily People Tested (part 1)
Estimation of the number of people undergoing virus tests in England prior to de-duplication of data records (rev 1.1)
In my newsletter of 25th June we discovered something rather odd, with more tested people per week than tests declared per week under the pillar 1 scheme (clinical need and frontline workers). The same was found for testing under the pillar 2 scheme (wider community) until we started adding in all possible sources of test result (satellite laboratories, home kits and lateral flow devices).
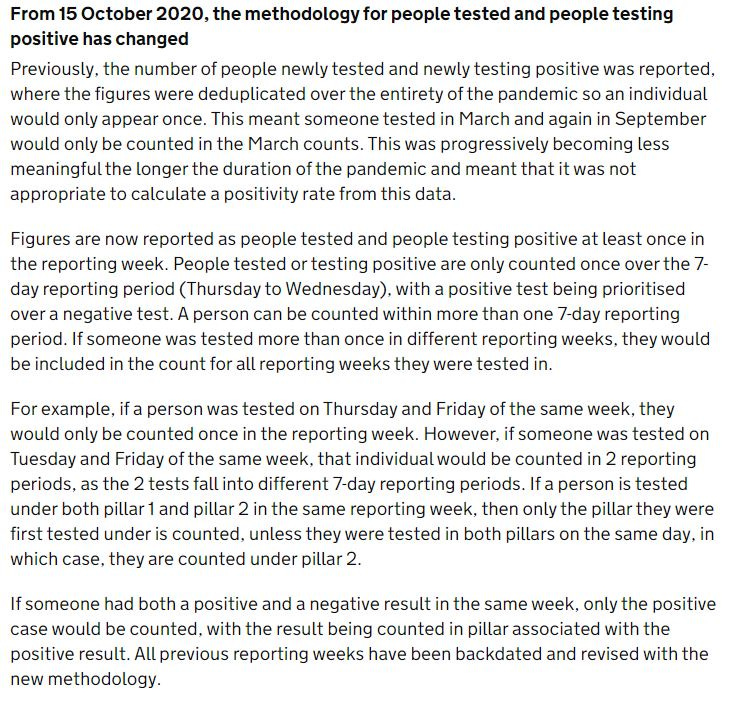
I raised the subject of de-duplication, this being an accounting method devised by the authorities that removes repeated test results for an individual such that only one test result is counted in each weekly accounting period. Definitions may be found here, and I attach a screenshot of the nitty gritty:
The trouble with this is that large numbers of negative test results are being binned, with preference for the reporting of positive test results only. In stats-speak we call this bias and ideally we should adjust for such bias if we are going to make sensible statements about detection rates. In the next few newsletters I’m going to jot down what I’ve been doing in the kitchen to tackle this and we shall start with the unpacking of the variable:
uniquePeopleTestedBySpecimenDateRollingSum
This variable is a 7-day rolling sum that is relatively easy to convert back to daily counts, but let us first take a look at the raw values as they stand:
There we go! If we check the definitions carefully we see these are unique people in the sense of uniqueness within an accounting week - the same person can pop up again the following week if they get tested. This is useful in terms of tracking unique individuals over time but is not at all useful if we want to consider bias introduced by multiple testing of the same person.
An Example
Let us suppose Adam undertakes a test each working day and this returns a negative result Mon - Thu but a positive result Fri. Given each test can return one of four possible outcomes (true positive, false positive, true negative, false negative) we cannot be 100% sure whether Friday’s result is a true or false positive and whether earlier results were true or false positives. We can make an educated guess but guessing isn’t knowing. Our guessing could lead us to counting Adam as a positive case for that week and de-duplication would erase the four negative results. Ideally our guessing should lead us to also considering Adam as negative case for that week but the data authorities don’t permit this kind of subversive thinking!
In reality Adam may or may not be genuinely positive for SARS-COV-2 since all will depend on his exposure and risk factors, which will determine his pre-test probability upon which test sensitivity and specificity (i.e. test performance) will work their magic. If disease prevalence is low and Adam hasn’t mixed with many people then his false positive probability will rocket and Friday’s test result will likely be artefact. If, however, Adam is living and working in a COVID hotspot with sick family members then Mon - Thu results are likely artefact. Since we don’t know Adam’s situation we can’t assume which of these scenarios is true. Despite this real-world uncertainty the authorities will bend the data their way regardless.
The way I get round this is to consider all of the tests Adam has undertaken and numerically declare him as being 20% positive rather than 100% positive; this way I’m acknowledging the positive result but I’m hedging my bets by also considering his negative result count. I can only do this if I can count all the tests Adam has undertaken in each accounting period, which makes de-duplication a right pain!
Unpacking The Variable With The Long Name
Using bit of jiggery-pokery we can get back to the daily counts of unique people tested that go to make up the rolling 7-day series that we have just considered. When we do this we get a rather strange slide:
This starts off sensible with positive counts of people increasing each week, and we can see the weekly ebb and flow of test processing. On Monday 28th Dec 2020 something crazy happens and we find an entry of -72,938 people. A negative entry of -38,197 people occurs on Monday 18th Jan 2021 and then from this point onward we find sizeable negative entries on every single Monday up to 21st Feb 2022 when the count moves into negative for both Monday and Tuesday of each week. I did ask two members of the dashboard team to explain this and am still waiting for a reply some 399 days later.
What I think Is Happening
What I think is happening is that the dashboard team are not responsible for crunching the numbers, they simply throw them at the dashboard for public consumption. Somewhere down in the dungeons somebody has decided the easiest way to arrive at a figure for unique people tested for the previous accounting week is to derive a book-keeping entry every Monday that negates all the subsequent tests they have undertaken in the prior accounting period. Quite why they changed the system again on 21st Feb 2022 is beyond me unless book-keeping entries on a Tuesday help mop up any surplus.
Blanking The Book-Keeping
If we blank all the negative book-keeping entries then we arrive at this slide…
We can’t see the holes at this scale, all we can see are the positive counts prior to de-duplication, which means we are closer to fathoming how many times Adam presented himself! I’ve plonked down a LOESS regression function to guide the eye through the strong weekly pattern. This peaks at around 650,000 daily people, which factors up to 4,550,000 testing folk per week, this being a darn sight more than the peak of 3,800,000 testing folk per week if we rely on the rolling 7-day variable with the long name.
Now we are getting somewhere.
Kettle On!