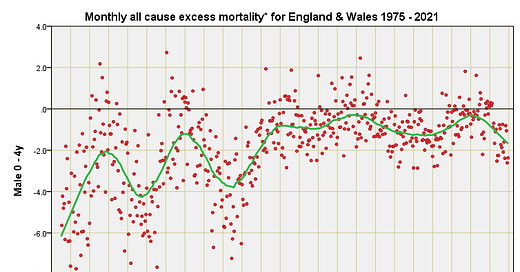
Excess mortality 1975 – 2021 (part 1)
England & Wales monthly excess mortality by quinary age band & sex: males under 45y
In my previous post we looked at monthly excess mortality for the period 2018 – 2021. The pandemic glared at us through the older generations as did delays to processing of death certificates for the younger generations for the latter part of 2021. If we stick with looking through the equivalent of an epidemiological letterbox we are going to lose perspective and we are going to think the pandemic was a vast and terrible plague descending from out of the blue yonder that called for all manner of draconian measure. In the following series of 36 slides I am going to pull the focus back to the period 1970 – 2021 so we may determine whether SARS-COV-2 is something to be truly feared or whether dramatic hits on mortality from one contagious pathogen or another are par for the course.
In these slides the scatter of individual red dots will reveal general trends as well as seasonality, with outliers indicating disease outbreaks. The green wavy line is a LOESS smoothing function merely to guid…


