Exploding A Myth Using The Cross-Correlation Function

My last three posts on independence of measure seem to have gone down well with some folk, though I do appreciate how much this issue can mangle the brain! If I were to speak as bluntly and plainly as possible it would be to say all manner of nonsense is being uttered by all manner of expert who all clearly dozed off at the back of the stats class at the point when the lecturer raised the subject. This means we are swimming in analysis after analysis that offer conclusions that may be as sound as stating children shrink as they age (see post dated 16/11/21).
To give a flavour of how deep the crisis goes we may see the virus spreading with folk getting ill, we may see more and more tests being done, and we may see more and more positive results. We may jump to the conclusion that more virus means more tests means more confirmed cases but even this most fundamental understand might easily be invalid, as incredible as it seems.
Imagine for one moment that there is no link between virus levels and testing, and no link between testing and identification of positive cases, the whole thing being random. If the virus spread and declined over time just doing its own thing, and labs ramped up testing over time regardless of the outside world, and positive cases were merely a random result then we’d still see an illusory relationship between all these three random variables and think we are seeing something genuine. Until we tackle the deep issue of time dependency we can’t say anything whatsoever about the pandemic unless, of course, we’re happy to live with shoddy stats and confirmation bias.
So let us take two of these time dependent variables – daily viral tests undertaken and daily new COVID cases detected for England and run them through the big brother of the autocorrelation function, this being the cross-correlation function (CCF). This brain-mangler of a signal processing technique takes two time dependent variables and looks at the bivariate correlation between them over a series of lags. We thus get to see how they are ‘bouncing off’ one another over time. We can also remove any low frequency component associated with disease progression or development of test facilities to see what harmonics are left that represent the dynamic interplay between test activity and detected cases.
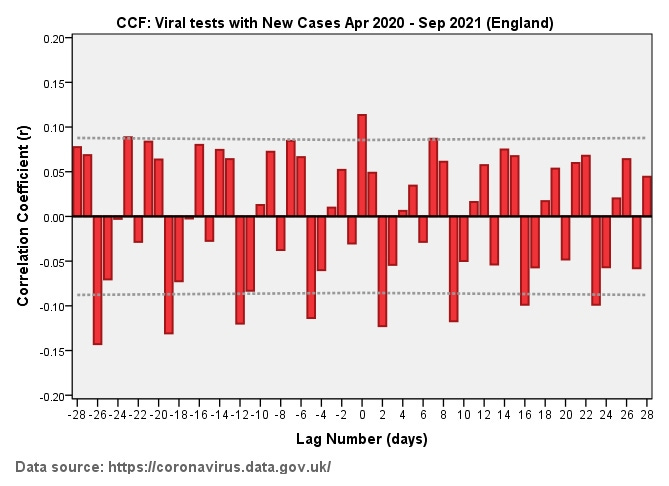
I now present the cross correlation function of daily viral tests with daily new COVID cases for England for the period Apr 2020 – Sep 2020. We observe extremely poor correlation, with signal peaks only just popping beyond the 95% confidence intervals (dashed lines). There is a single modest positive peak at lag zero to support the notion of more testing means more identified cases and that’s it. Of greater interest is the collection of negative peaks occurring at weekly intervals. Negative values denote an inverse relationship such that more testing yields fewer cases (and vice versa), and the weekly pattern once again reveals this is nothing the virus can be doing: those 7-day regular pulses are arising from testing regimes. We thus arrive at yet more evidence of test artefact and have crushed the notion that testing is somehow following the outbreak; it’s not. In the immortal words of David Walliams, computer says no.