Hospitalisation Rate For Adult Respiratory Conditions (part 5)
Lessons from an undisclosed NHS Trust
So far in this series we have been eyeballing weekly data sliced into yearly chunks so we may compare hospitalisation rates on a week-by-week basis with historical values. In the next few slides I am going to bolt the data together so we may get a feel as to what has been happening across time (time series analysis). We’re in for some surprises so I thought I’d start nice and gently with a time series of adult respiratory admissions to the emergency department (dashed grey lines represent the annual periods)…
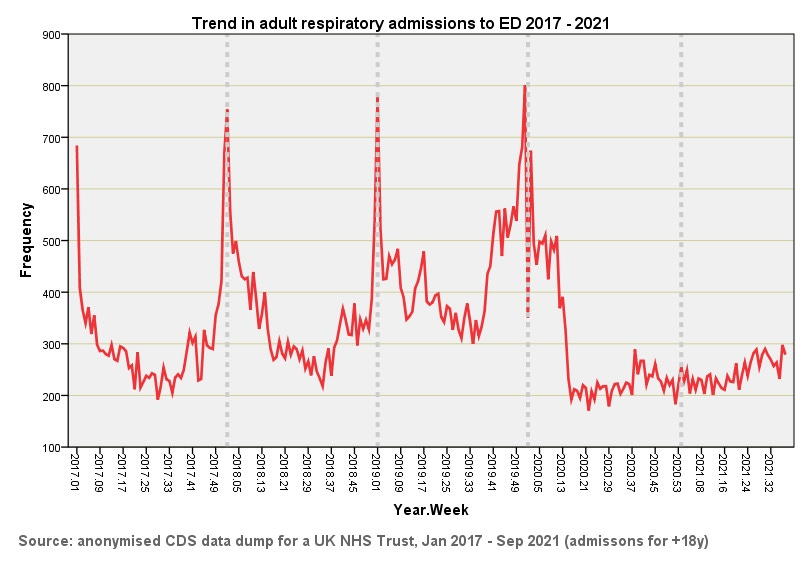
We now see a regular burst of departmental activity aligning with the beginning of each year for 2017, 2018, 2019 and 2020. After 2020 things go wonky with no seasonal burst for the beginning of 2021. This is extremely odd, to say the least. What is also odd is that the biggest peak my eyeballs detect is the pre-pandemic seasonal peak for winter 2019/20. What happened to the pandemic? The ‘pandemic’ seems to squeeze into a nodule of activity during April/May of 2020 and that’s yer lot!
So where are the second wave and the third waves? Why are adults with respiratory conditions (which include COVID-19) not being shipped into the department at record-breaking levels? Why are things so flat after June 2020? How can this emergency department claim to have been so busy with COVID-19 admissions? I am going to put my hat of heresy on and suggest they were not busy with COVID admissions proper (folk gasping for breath) but folk coming in with broken toes, sliced thumbs and alcoholic poisoning who happened to test positive.
In the second slide below we get to see what happened to these admissions. We observe 2017 kicking off with an equal split between respiratory cases being sent home and respiratory cases being hospitalised. Toward the end of 2017 this changed and we see a greater proportion being discharged, this indicating an outbreak of something rather mild. During spring and summer of 2019 we observe another equal split before another mild outbreak hits the 2019/20 winter season…
There’s something interesting going on from 2019/w40 to 2020/w11 with an unusual flurry of admissions that end in discharge. If I asked that Martian again I am sure they’d point to this significant green block and suggest that is when the pandemic happened. They’d then likely ask me why the UK government decided the pandemic didn’t start until Feb 2020 and I’d probably respond with words such as ‘flying’ and ‘buzzards’. After 2020/w16 we enter the twilight zone where we observe another equal split between respiratory cases being sent home and respiratory cases being hospitalised at a frequency matching that last seen in 2017.
So how does all this translate in hospitalisation rates for adult respiratory admissions over time? I recommend you pour a strong, sweet tea for this next slide since this is what I had to so after concocting it! My first words were “what the absolute fudge is going on?” swiftly followed by, “ship, have I made a mistake in the spreadsheet?” The answer to the latter is no, I did not make a mistake, but you can now see why I went plotting out the raw counts!
What we have here are square waves that are always indicative of administrative, managerial, protocol or policy change i.e. anything and everything non-medical. A decision was clearly made in 2017/w39 to stop giving beds to adult respiratory admissions. Ward closure can do this, along with a staffing crisis or even a transport crisis. The problem was suddenly solved in 2019/w5 until a hiccup spanning 2019/w39 to 2019/w47, followed by an odd middle period lasting until 2020/w11. So here’s my barbed question: did the pandemic really strike after 2020/w11 or are we simply observing a NHS Trust solving patient management issues that then gives the impression of elevated bed use?
Whatever the reason for this jiggery-pokery we can plainly see that hospitalisation rates post-pandemic for COVID and non-COVID respiratory admissions are nothing special. Rather odd for a novel SARS coronavirus don’t you think?


"...protocol or policy change i.e. anything and everything non-medical" - good guess! Maybe that can be confirmed. Yet another easy tool to manipulate the public perception.... if they want to do so. But what's much more difficult to manipulate is the deaths count.