
It Would Have Been Worse (part 1)
Having a peek under the bonnet of pro-vaccine claims

I hope by now that even the most unenlightened members of society have realised that four doses of the elixir doesn’t prevent COVID. Friends and family who have been first in line for the initial, second, third and fourth jab are dismayed that they’ve been testing positive, with COVIDesque and other symptoms breaking out on a regular basis. The thought that it might be the jab never occurs to them, and those who’ve seen their doctor are told their repeating bouts of mystery illnesses cannot possibly be the jab; so they soldier on. If anybody asks how they’re faring with their second bout of COVID this year they invariably respond, “not too bad, but it would have been worse without the vaccine.”
Is that so? Let’s go find out…
Levelling The Test Match
It should be pretty obvious that we are able to count more COVID cases if we undertake more COVID tests. If, say, the infection rate amongst the population was 1% (1 in 100 people infected) then we’d expect to detect just 1 COVID case if we undertook 100 tests and 1,000 COVID cases if we undertook 100,000 tests. This isn’t a case rate rise and is only a rise in the case count because we’ve undertaken more tests. If the goodly folk of England don’t understand basic maths then we’re all doomed.
I’m pretty sure that databods at ONS, Public Health England, UK GOV, UKHSA etc understand such basic maths and so can only conclude they have set out to deliberately misinform the public with headline charts such as this one.
So let us start out this misty morning by addressing such numerical nonsense and by calculating something far more useful like the number of COVID cases per 100 viral tests. Let’s do this for PCR and LFD tests separately, and let’s break detection rates down by month and year into a series of easy to understand and colourful charts. There’s nowt more satisfying than getting your crayons out!
First, a few words…
The spindly little black lines you’ll see are 95% confidence intervals around the mean. If these lines get tangled up across years then any differences you see are not going to be statistically significant at this level of confidence.
If the vaccines are conferring benefit in terms of lowered infection rate then the series for 2020 (pink blobs) will be sitting at the top, with the series for 2021 (yellow blobs) sitting below since folk will have been dosing up. Right at the bottom should be the series for 2022 (green blobs) because these are triple and quadruple-vaxxed folk. Think of a traffic light and there you have it. Do you see red (pre-vaccine), then amber (partly vaxxed nation), and then green (fully vaxxed and boosted nation) in that order or do you see something else?
Case Detection Using PCR
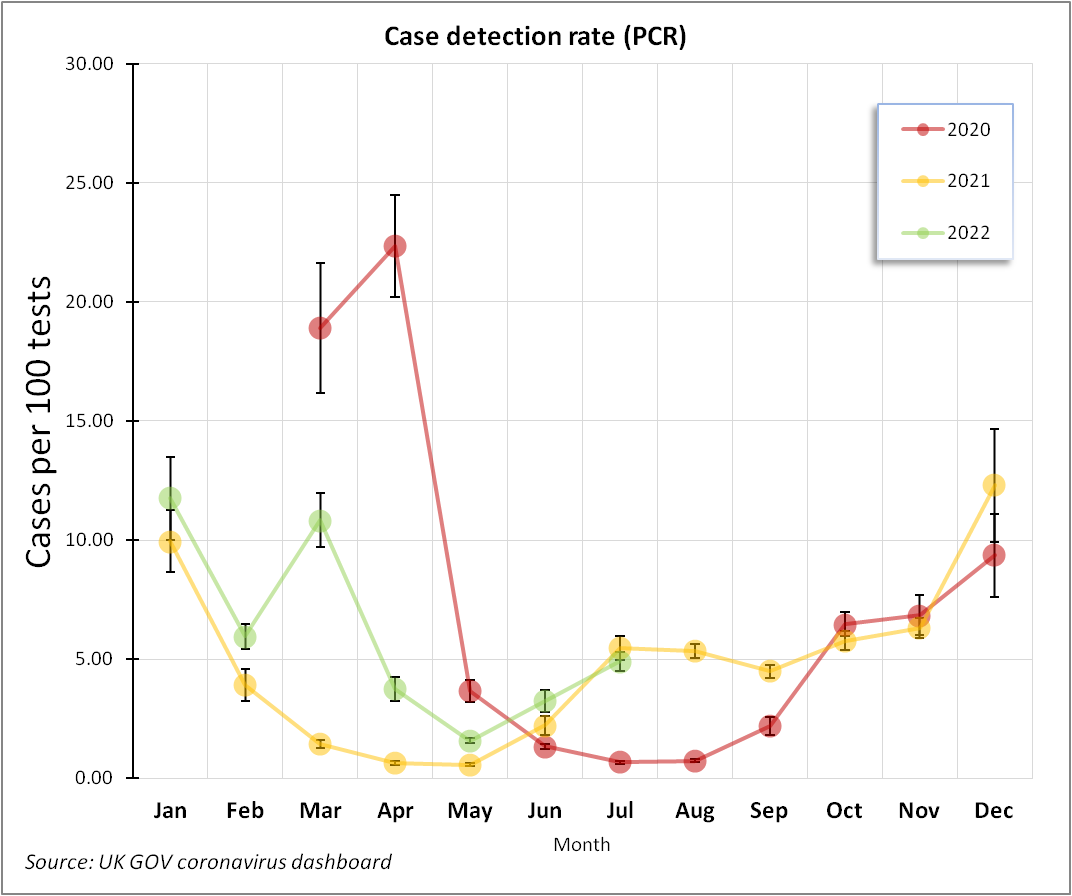
If we squint at the slide for PCR we observe 2020 kicking off with tremendous detection rates in March and April. This isn’t surprising because back then PCR testing was reserved for those few folk who rather ill in hospital; a captive audience as it were. As testing rolled out under the pillar 1 and pillar 2 schemes more and more of the general population were tested rather than those in clinical settings, and so we see the detection rate drop. The rate rises again toward the 2020/21 winter peak, as we again expect. Nothing surprising here; all good stuff etc etc etc.
So that was 2020 behaving itself. We didn’t start vaccinating the public until 8 Dec 2020 and so 2020 is essentially virginal soil and COVID did what it wanted to do. As 2021 rolled along we had a tremendous surge in uptake across the UK, with the vast majority getting the jab early and a goodly number also getting a second jab. Quite why a second jab was necessary wasn’t really explained to the general public but the cynic in me suspects the manufacturers don’t really know what they are doing with the new technology as yet. Neither do I recall seeing any safety assessment for two doses other than the usual talking heads claiming, “it’s all safe, it’s all safe!” across mainstream and social media. But I digress.
If all that jabbing came with benefits then we’d see the series for 2021 rolling along underneath the series for 2020 on a month-by-month basis (all things being equal). It certainly starts out that way but come June 2021 we observe an inversion whereby detection rates for a semi-vaxxed 2021 exceed detection rates for an unvaxxed 2020. The two series end their annual cycles by dancing together. So where’s all that benefit for a vaxxed-up nation? Apart from the three months of March, April and May there ain’t any observable benefit in terms of detection rates (a proxy for infection rate).
So, surely the grand booster year of 2022 will come to the rescue of a failed product and save everyone? Nope, no, nay and нет. The series for 2022 starts out in January with disappointingly similar detection rates to 2021, thereafter the series rises indicating greater rate of infection amongst the hyper-vaxxed public. Come June 2022 and we see our traffic light system upside down. The word is wergh! Take away March and April 2020 and you’d be hard pushed to convince a Martian that vaccination has done anything in terms of reducing infection rates.
This is not new news to those who keep their eye on the global research effort, but ask your neighbour if they’d like to mingle with unvaccinated folk around the BBQ and they’ll squirm and shudder, with their internal logic in disarray for these are the vaccines that only start to work if everybody is vaccinated. I ran out of face to palm months ago. They say “you couldn’t make it up” but someone clearly is; and they’re getting away with it big time.
Case Detection Using LFD
So that was PCR - the mainstay of clinicians everywhere and the gold standard diagnostic test for COVID that turns out to be plastic with a bit of glitter. How about the ingenious test that enabled mass DIY diagnosis for the first time in medical history and make some shareholders very rich indeed?
Well, if we squint at the following slide for COVID cases detected through use of LFD test kits we see something quite extraordinary; we see an upside-down traffic light! There’s not much data for 2020 since test kits were not generally available in large quantities until the end of October but we do have two points for November and December and these tell us that double-dose vaccination hasn’t done anything overtly beneficial that we may readily observe.
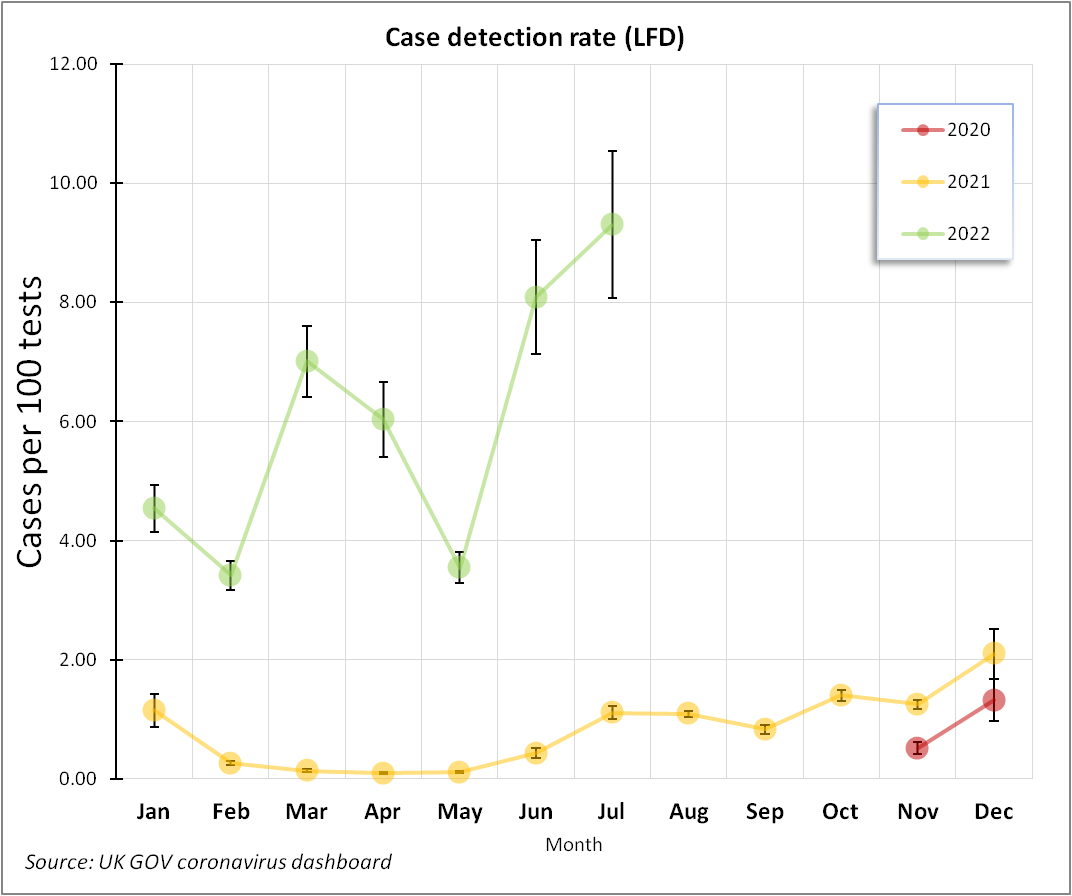
Of course there are some who will still try and claim “yes, but it would have been worse without the vaccine”. As we can clearly see it wasn’t worse without the vaccine: it was better.
I guess what these pro-vax robots are trying to squeeze through is the notion of a much higher series for 2021 that would have been the case if the vaccine hadn’t lowered rates to where they are. In doing so they’d need to argue that 2021 mutations were somehow more virulent than the original novel strain that hit a hitherto unexposed public. They’d also have to ignore any notion of natural immunity kicking-in (whether vaxxed or not) plus a fair few other things. This is all hypothetical mumble-wumble, and unless this hypothesis can be put to rigorous empirical test (no, this does not mean computer simulation, thank you very much!) then it remains unfalsifiable and therefore unscientific. What we actually see is evidence of a vaccine that doesn’t work to reduce infection; what we fancy is a different matter.
Just to press this point home the series for double-vaxxed and boosted 2022 takes off like a rocket and doesn’t come out of orbit even after the fourth jab. How is it possible that a super-vaxxed nation yields higher case detection rates than a semi-vaxxed nation, that yields a higher case detection rate than an unvaxxed nation? It ain’t workin’ guv’nor; that’s as plain as me bugle on me boat. Only a garden tool would fall for that!
Anybody still thinking that the vaccine confers benefit in terms of lowered infection rates needs to get a strong pot of coffee on the stove and eat as many blueberry muffins as it takes for these slides to sink in. Anybody thinking that the vaccine might confer benefit in terms of lowered severity of symptom needs to open the biscuit tin and wait for the next instalment…
Kettle On!
The case detection rates are affected by the games played with the cycle threshold and s gene dropout tricks for Omicron etc. The powers that be will argue we had more sensitive tests in 2021 and 2022. LOL.
Doesn’t a theory have to be falsifiable (rather than verifiable) to count as scientific?