NHSUK: Full Dose Benefits

Whilst unravelling the many biases that need to be accounted for before getting stuck into modelling vaccine benefit/disbenefit I thought I’d double check matters by considering the advantages conferred from full vaccination. By that I mean we should see dose 2 reducing the incidence of in-hospital COVID death compared to dose 1, and especially for the period May – Sep when full dosing of the UK public was well underway and immunity presumably in full swing. Makes sense, right? Following the science, right?
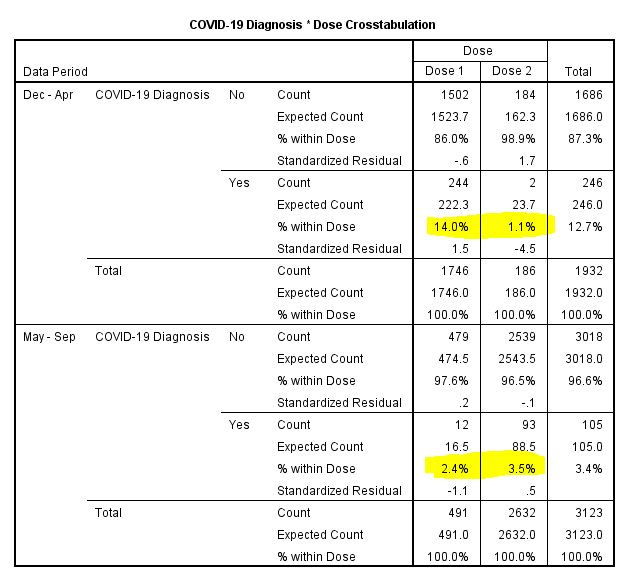
Below is what we see for 5,055 in hospital deaths for a substantial UK NHS Trust that must go unnamed. If everybody can whip their calculator out we can all derive a crude odds ratio of 0.08 for the period Dec – Apr (= 1.1% / 14.0%). This tells us that full dosing has been massively beneficial – good news! Let us now calculate the odds ratio for May – Sep. Oh dear; we arrive at an odds ratio of 1.45 (= 3.5% / 2.4%), which tells us that full dosing has made things worse during the very period when we’d be expecting to be waving flags of relief, joy and happiness.
Before anybody gets too depressed we better run a stats test, and I rather fancy Fisher’s Exact Test for a 2 x 2 table. Fisher is telling us that the Dec – Apr result is solid (p<0.001), whereas the May – Sep result is a soggy bottom (p=0.274) and to be ignored: a bit of relief maybe.
So what happened here? In a nutshell we compared apples to pears and called them bananas. In jargon-speak we fell foul of substantial bias by not accounting for the many factors we need to take account of before we run our analysis. Anybody offering assessments of vaccine benefit ideally should reveal to you how they identified and handled these biases.