Pandemic Progress
Delving into the dashboard

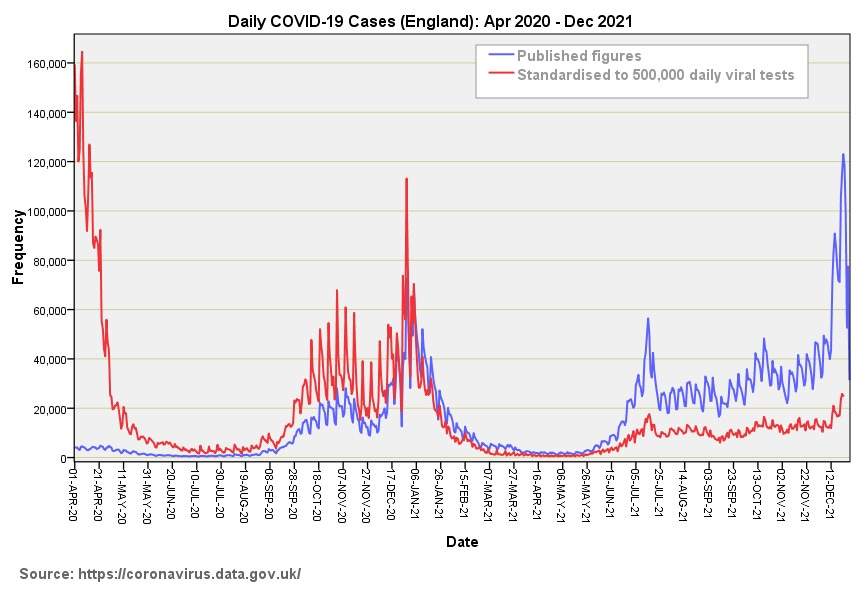
With my EPR data sample now becoming a little stale (records end 22nd Sep) and no obvious prospect of an update I thought I’d turn my attention back to data published by the UK GOV coronavirus dashboard team, the Office for National Statistics (ONS) and NHS Digital. It’s been a long time since I saw a simple slide of daily COVID-19 cases and fancied starting out with this. Trouble is way back in May 2020 we were undertaking an average of 66,398 viral tests per day across England, whilst back in May 2021 we had bumped that to 853,692 viral tests per day, this representing a whopping great factor increase of x12.9! Do you think we just might be capable of detecting more cases during 2021 than during 2020? I certainly think so, though this bias doesn’t seem to bother the authorities or folk who should know better.
Over the period 30th Jan 2020 – 27th Dec 2021 the grand daily mean for test activity in England under pillar 1 and pillar 2 schemes fetches up at 532,799 tests per day. This prompted me into standardising COVID-19 case counts for a nominal test rate of 500,000 tests per day and comparing this curve with the published figures. Obviously there are many assumptions made here, but that is pretty much par for the course for any diagram we gaze upon!
What I wanted to do here is get a feel for the progress of the pandemic when we level the playing field in terms of test activity, and I am hoping folk will get a better feel for what actually happened as opposed to what the authorities and media claim was happening. We now see that the first wave was likely the biggest of them all. I say ‘likely’ because so many things changed in addition to test frequency.
What bothers me the most is that peculiar ramp from July 2021 onward. This doesn’t feel like a classic, new strain viral outbreak to me; it feels rather more like the steady progress of cases commensurate with the steady progress of vaccination. I am sure I shall get my bottom smacked for saying so!