Prior Risk Of Death (part 1)
I attempt to derive a more sophisticated measure for how sick in-patients are in the first instance and find something rather unexpected

OK, so I know this is going to sound crazy but I want to know exactly how sick people were before they died. Up to now I have been using a proxy called Diagnoses that is simply the number of diagnoses listed in the EPR, on a scale of zero to ten (there being a total of 10 diagnostic fields in the data dump I was given). This has done a decent job of accounting for case complexity prior to death and works alongside age, sex, disease prevalence, incidence of major non-respiratory morbidity, incidence of chronic respiratory disease, and probable COVID in helping level the playing field for a real world sample of cases so that we may more reliably assess vaccine harm/benefit using statistical modelling. Here’s my idea in three slices…
Establish the incidence of each of 11 primary diagnostic groupings across the entire sample of 57,557 in-hospital deaths over the period 2017 – 2021 in terms of a fractional value.
Sum the fractional values for each primary diagnostic group on a case-by-case basis to yield an aggregate value.
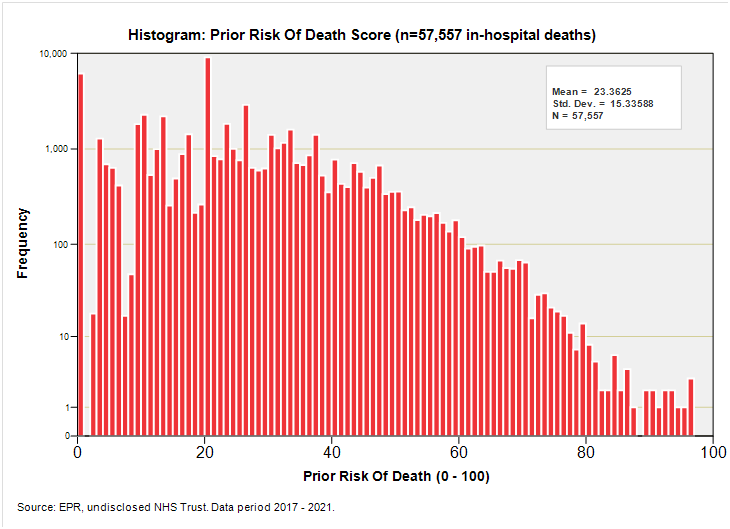
Transform aggregate values into risk scores on a scale of 0 – 100 to give prior risk of death (PROD).
To give you some idea of how this turned out for the entire sample of 57,557 deaths I shall reveal the mean score fetched-up at 22.4, with a median score of 20.2, minimum of 0.0 and maximum of 100.0. The distribution is positively skewed and looks like this if we use logarithmic graph paper: