Spectral Analysis Of Certified COVID Death (part 1)
I utilise an engineering tool to investigate periodicity for certified daily COVID death within England for the period 30 January 2020 – 6 October 2023

For my final fiddle with spectral analysis I fancied pulling down new daily certified COVID deaths for the nation of England from the UK GOV coronavirus dashboard. You can obtain the data yourself by working through the menus or you can take advantage of the API programming language that is used for the download section. Here’s the API code I used to shovel the latest data to disc with a minimum of fuss that you can copy into your browser:
https://api.coronavirus.data.gov.uk/v2/data?areaType=nation&areaCode=E92000001&metric=newDailyNsoDeathsByDeathDate&format=csv&release=2023-11-02
I’ve covered what this count means in several articles so will just quickly mention that we’re talking about daily deaths by date of death for those folk with mention of COVID-19 somewhere on the death certificate (section I or section II). These are thus counts of deaths with COVID as well as deaths that have been declared to be due to COVID. Though rather dubious PCR test results will have dominated matters these will have not been the only consideration for certifying physicians. We should note that a positive test result is not required for the purposes of certification since ICD10 emergency code U07.2 (originally defined as COVID-19, virus unidentified) can be invoked for suspected cases, this being a catch-all code to cover a clinical diagnosis (as opposed to a lab diagnosis). Surreal as it may seem we need to think of these counts in terms of deaths with suspected COVID (whatever this means). Coming from a clinical audit background I am tempted to utter some rude words.
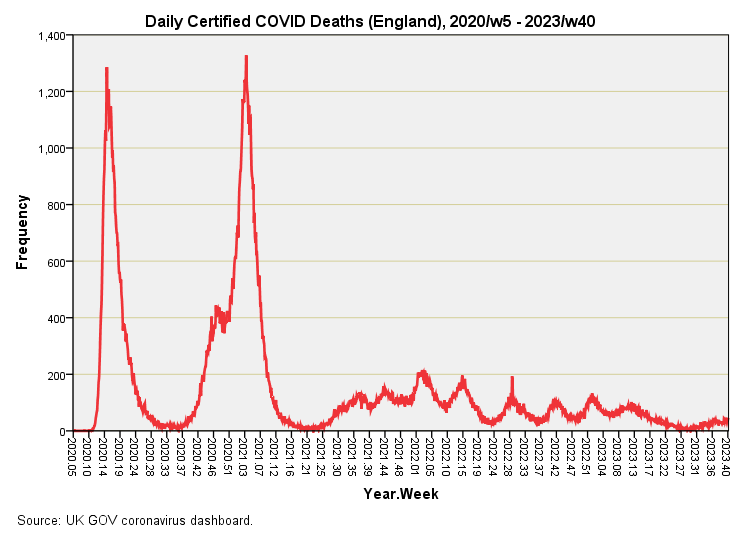
That’s my Monday morning rant done so I guess I better make a start by getting the kettle on and plotting these surreptitious counts out as a time series: