Primary Clinical Outcomes For A Single Emergency Department 2017 - 2021 (part 1)
Further analysis of an anonymised data dump of 1.9 million admissions records to the emergency departments of an undisclosed NHS Trust for the period Jan 2017 – Sep 2021
Now that we’ve got a better handle on the emergency department (ED) case profile over time my bubbling brain is wondering if there’s something extra tasty we could squeeze out of the data at this point. Assessing clinical outcomes for a busy cardiac surgery unit and cardiology department was once my bread and butter so I trend to think along these lines when it comes to COVID and the vaccines. In the CDS 010 dataset I’m sitting on there are essentially two primary outcomes of note, these being the decision to treat within the ED and the disposal route, which basically boils down to discharge home or admission to hospital.
Some folk might prefer I look at deaths within the department as a clinical outcome but since these amounted to just 1,830 cases out of 1,928,918 admissions (0.09%) for the entire period January 2017 – September 2021 then I’m not going to be able to do very much fancy fiddling on the statistical front, so shall put this idea on the top shelf in the pantry for the time being.
Decision To Treat
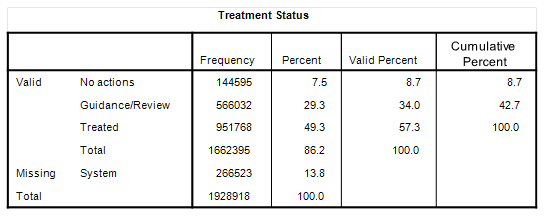
In terms of decision to treat we can divide actions into three basic categories: no action undertaken; guidance and case review only; treatment given. Here’s how those 1,928,918 admissions to the department break down for the period January 2017 – September 2021:
Readers may be surprised to learn that treatment was given in just 57.3% of cases over this 45 month period (where relevant data have been logged in the administration system). Such treatments could have been anything from administration of eye drops to cardiopulmonary resuscitation.
If we lump ‘Guidance/Review’ with ‘No actions’ then we can muster a rather neat binary indicator variable for the purpose of modelling of clinical outcome in terms of decision to treat.
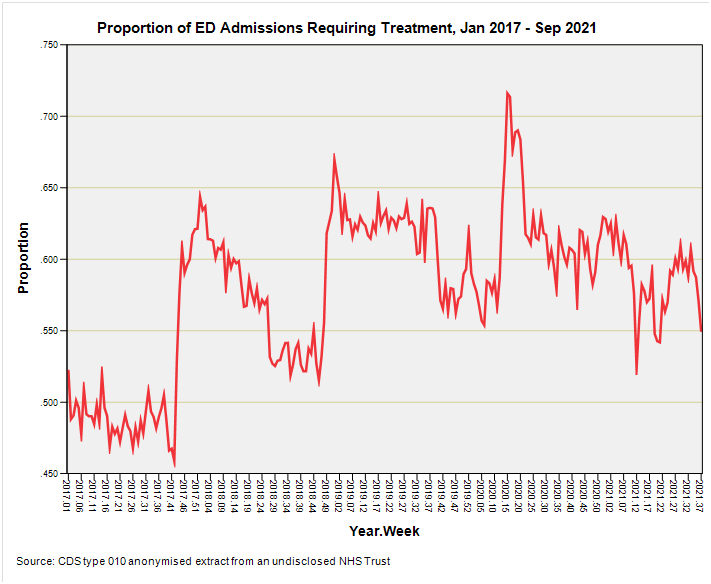
We can look at this variable over time and we can run staged multivariate logistic regression models to assess the impact of the pandemic during 2020 as well as the impact of vaccination during 2021: an exciting prospect! Here’s the binary indicator variable turned into the weekly proportion of emergency department admissions receiving treatment of some sort or other for those 1,662,395 data records where the treatment has been recorded (86.2% data capture):
This is fascinating! That first leap upward took place 2017/w42 (w/e 20 Oct) – 2017/w45 (w/e 10 Nov) and may well be a mixture of respiratory disease with the fungal spore count maxxing out under cool-damp conditions as well as elevated risk of accident and injury arising from the first frosts, fog, slippery leaf litter and the like. We’ve also got to consider the spectre of hypothermia in the homeless and elderly and, of course, the outfall of bonfire night.
The second leap upward took place 2018/w46 (w/e 16 Nov) – 2018/w51 (21 Dec) and my money is on the same raft of weather-related factors as well as festive intoxication and seasonal grots.
What is most peculiar is the lack of a leap for the same blustery period during 2019: for some inexplicable reason we have a dip where a bump should be. Poor weather, fireworks, homelessness, road accidents and boozing are pretty much a constant in these dismal islands so what changed to make A&E medics less keen to treat back in the run-up to the 2019 festive season just prior to the pandemic?
This is most odd and I can’t help wondering if there is there some hidden factor we should know about; a policy change, perhaps, or instructions from upon high. Maybe the casemix changed dramatically, with ED inundation by folks suffering from that unacknowledged mysterious UK-wide pre-pandemic flu-like illness. Sending a whole bunch of snozzy folk home after offering guidance alone would certainly flip the data.
The third and final leap upward on this slide took place 2020/w11 (w/e 15 Mar) – 2020/w16 (w/e 19 Apr), which puts us slap bang in the catastrophic health collapse period of murky service provision and iatrogenic mayhem. Whilst this suspicious spike is to be expected there’s a cheeky monkey sitting on my shoulder asking if this was the 2019 treatment spike slid forward in time as a result of some dodgy strategic decisions. Maybe not, though, for the casemix surely would have swung to the more serious end of things as folk avoided the emergency department like the plague during lockdown. This leaves us scratching our heads as to why the back end of 2019 didn’t furnish the usual leap in treatment. Perhaps we were all in bed at home clutching hot water bottles and swigging Night Nurse.
One final feature of this slide that I’d like us to consider is the increase in the proportion of emergency department admissions requiring treatment over time, and to what feels like a plateau. Were the good folk of this region of England genuinely getting sicker over time or were senior management messing about with resources, protocols and policies? Sit down with any senior clinician and the subject of drug budgets will crop up within the first 20 minutes behind a list of grievances longer than your arm.
Disposal Method
We can take the same KISS approach with disposal route by boiling down the various options into just three basic categories: discharged; discharged with referral; hospitalised. Here’s how the numbers look:
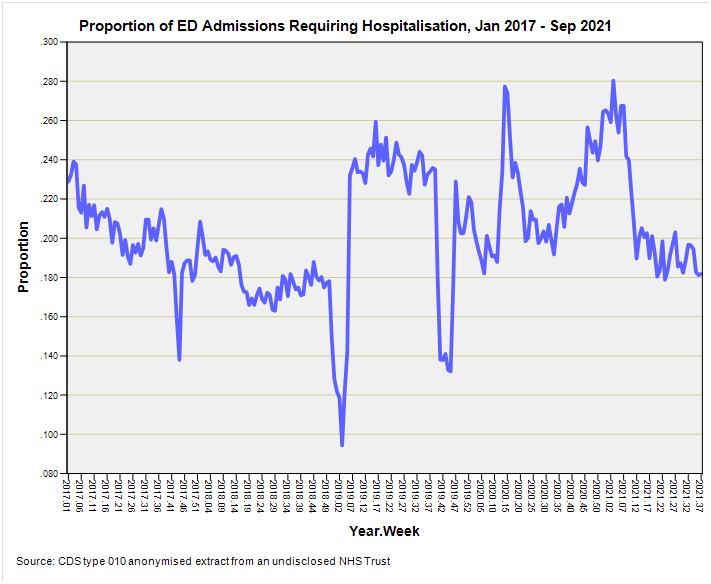
As a rule of thumb, and ignoring data holes and deaths in the department, we can say that one in five folk get admitted to hospital if they attend the emergency department for any reason. Just to clarify: referred folk are actually discharged from the department, with outpatients being a popular referral destination, but we can simplify matters further and combine both discharged and referred categories to count all those fit enough to make their own way someplace else. If we do this we end up with another handy binary indicator for the purpose of staged multivariate logistic regression modelling. This is how this variable looks over time when translated into the weekly proportion of admissions requiring hospitalisation:
More fascination from a simple binary variable! This time those three whopping great sharp dips grab my attention. The first of these centres on 2017/w43, the second on 2019/w03, and the third on 2010/w43. These pretty much correspond to the leaps in treatment so we’re looking at a seasonal swing in the casemix that requires less dramatic care.
There isn’t a similar dip in ward bed use for 2020 and, in fact, we witness the greatest reliance on ward beds during 2021/w3 (w/e 22 Jan) immediately after vaccine rollout. This is not exactly indicative of ‘safe and effective’ by any stretch of the imagination. A close second is 2020/w14 (w/e 3 Apr) when all hell was breaking loose across the nation.
Coffee & Cogitation
So there we go. In this article I’ve highlighted two clinical outcomes that we can use to explore the impact of COVID as well as vaccination harm/benefit via statistical modelling of just under two million electronic patient records. We’ve seen how these binary indicators vary over time and in forthcoming articles we’ll see how they fare as dependent variables in staged multivariate logistic regression modelling. Questions I shall attempt to answer using this methodology are:
Did elevated levels of COVID across the nation of England result in increased likelihood of treatment within the emergency department?
Did elevated levels of COVID across the nation of England result in increased likelihood of hospitalisation?
Did receipt of the mRNA jab result in increased likelihood of treatment within the emergency department?
Did receipt of the mRNA jab result in increased likelihood of hospitalisation?
I’ve no idea what I’ll find or what technical snags I’ll run into but I’m pretty sure we’re all going to need the big teapot and several packets of biscuits.
Kettle On!


"Whilst this suspicious spike is to be expected there’s a cheeky monkey sitting on my shoulder asking if this was the 2019 treatment spike slid forward in time as a result of some dodgy strategic decisions."
🐒