
Using ARIMA To Investigate COVID Death (part 1)
Cranking the handle on the latest daily data sitting in the UK GOV coronavirus dashboard

Anybody wanting to undertake this analysis for themselves can do so by taking advantage of the splendid download section of the UK GOV coronavirus dashboard, which may be found here. I’m sticking with the nation of England as usual because it’s easier to obtain data, there also being more variables available for this nation via the dashboard and other sources.
To business…

This is how things stood in the dashboard archive in terms of certified COVID deaths and 28-day COVID deaths as at 27 July 2022: we have two distinct peaks and a strange, drawn-out rumble. Certification counts exceeded 28-day counts in the first wave because physicians did not need a PCR test result to back their opinion as to cause of death. The recent decline in certified deaths compared to 28-day counts is rather interesting and I’m not sure which series is the closest approximation to the truth! To kick things off I decided to go for certified COVID death as my dependent variable
The Slicer
Trying to model this entire series as one lump is almost certainly doomed to failure for many things changed in the course of the pandemic from mutations to definitions to patient management, to procedures to protocols and back. Then, of course, we have the vaccines doing their thing (or not). I thus reached for the slicer and sliced this series into three juicy segments using the point of minimal daily death counts as my guide.
Each slice may well require a different ARIMA model structure and this will provide useful insight. Obviously I can’t assess the impact of vaccines in the first segment and neither can I assess use of lateral flow devices but what I can usefully do is assess daily case count as an independent predictor of COVID death.
First Wave
Herewith a dual time series plot of certified COVID death and new COVID cases for my first slice of 175 daily records:
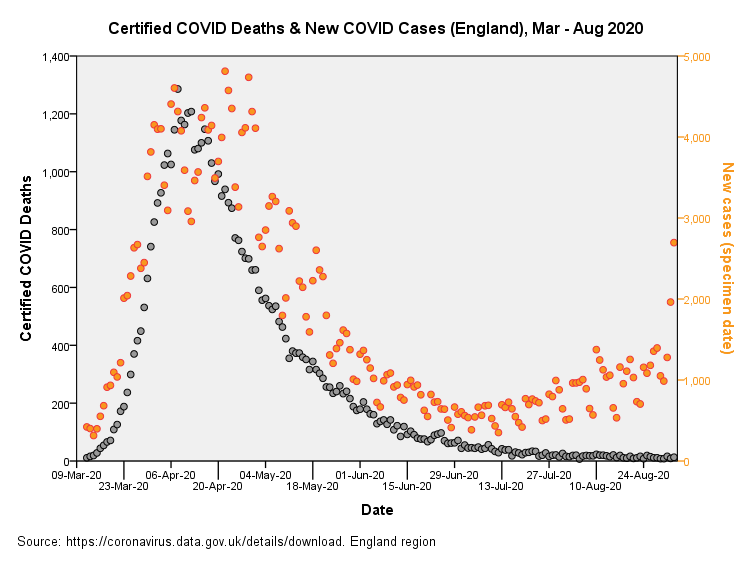
At the outset we see case counts rise before deaths but there comes a curious point during April 2020 when we observe a peak in deaths corresponding to a dip in cases. Toward the end of this slice the case counts rise as the testing regime goes nuts, with death dwindling to single figures.
In terms of crude daily mortality (certified deaths per 100 cases) the series looks like this:
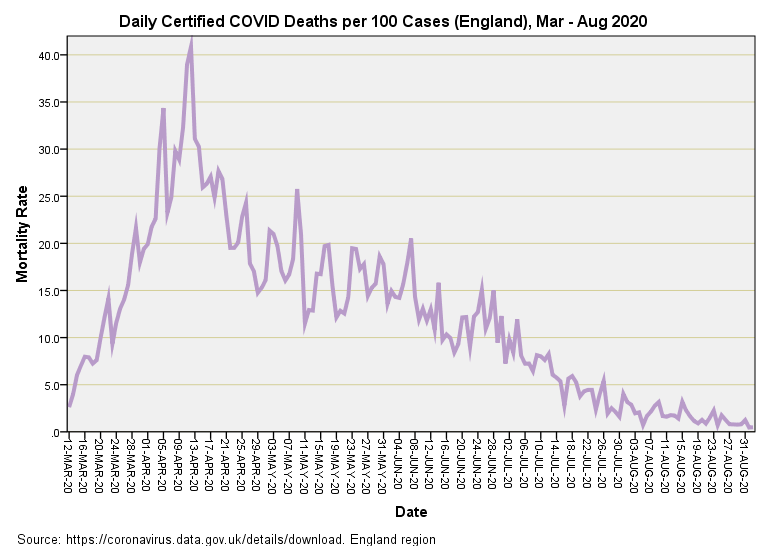
The series flies off toward an incredible +40% mortality rate but then again we have to remember that these first deaths were amongst folk who were already very sick in hospital. In fact the dynamics of this whole first slice are largely governed by what we may call ‘institutional death’ with nosocomial infection running rife.
First Wave ARIMA Results
The modelling process settled on an ARIMA(0,2,2)(0,0,0) structure which, when translated into English, means death accelerates quickly with a strong random (shock) component. No surprises there!
The good news is that new daily case counts made the grade as a highly statistically significant predictor variable for certified death (p<0.001). Herewith the tabular heart of the modelling run:
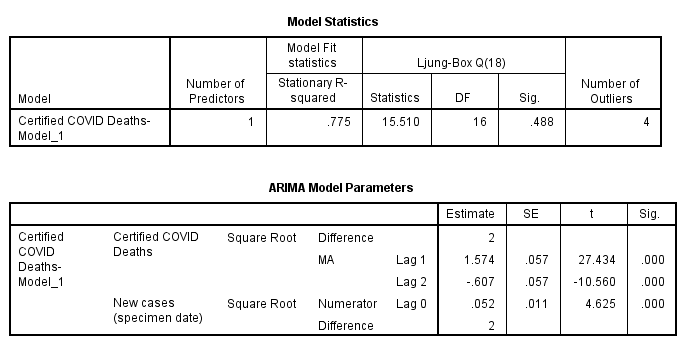
An independent variable can be highly statistical significant but not have any real world value in that the effect size may be teeny-weeny as to effectively have no practical meaning. In the case of… er… new cases the effect size (as estimated by the coefficient of determination) was calculated to be R-square = 0.190. This means that the daily variation in new COVID cases explains 19% of the variation we see in certified COVID death.
Now 19% isn’t bad going for an independent variable because death is a complex endpoint with many unknowns, and to predict something as wild and woolly as daily death using another wild and woolly variable is a big ask. No doubt if we smoothed both series to iron out some of the lumps and bumps of daily life we’d see case counts become a more effective predictor of certified death. As it is we’ve got a baseline model for deaths and cases that performs well that we can use to explore the impact of lateral flow devices and vaccines.
The Pudding
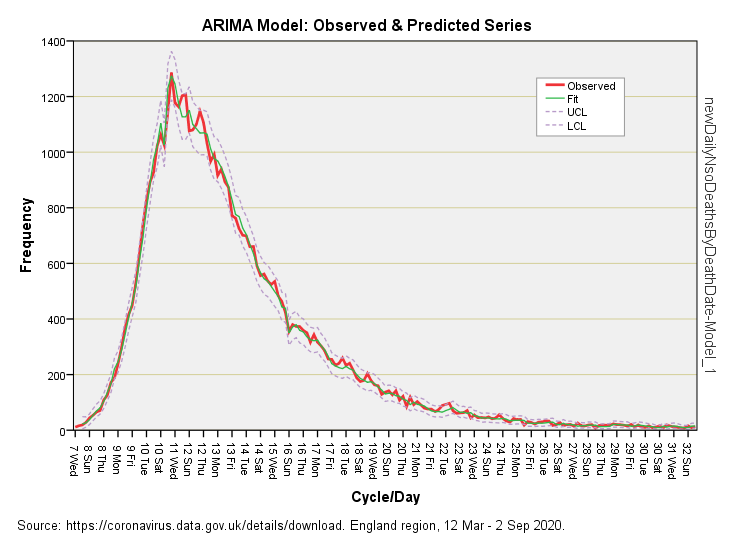
‘Nuff said! That ain’t a bad model even if I do say so myself.
In my next newsletter I’ll reveal results of modelling the second wave when folk went nose-poke bonkers. Until then, it’s…
Kettle on!
That 1st wave really does look like the curve predicted using a simple SIR model or a Gompertz curve.
Whilst writing, thank you so much for your explanation and custom analysis of ARIMA (re Hadcrut).
Is this raw counts? What if it was cases per 100k ? As corrected for double counting etc.