What Was COVID-19, Exactly? (part 3)
I investigate a cohort of 6,865 adult in-hospital deaths for two sample periods with high disease prevalence using split file, staged multivariate logistic regression
In part 1 of this series I presented a summary table of Pearson bivariate correlations revealing a correspondence between case detection rate (CDR - cases per 100 viral tests) and a whole bunch of diagnostic groupings from cancer to cardiac and back for 21,810 adult in-hospital deaths. If we presume that the PCR was detecting something then whatever that something was appeared to be associated with every medical condition you could think of, and I deemed this to be rather peculiar. A great deal of this malarkey will come about through comorbidity but we might expect a greater degree of differentiation than appears.
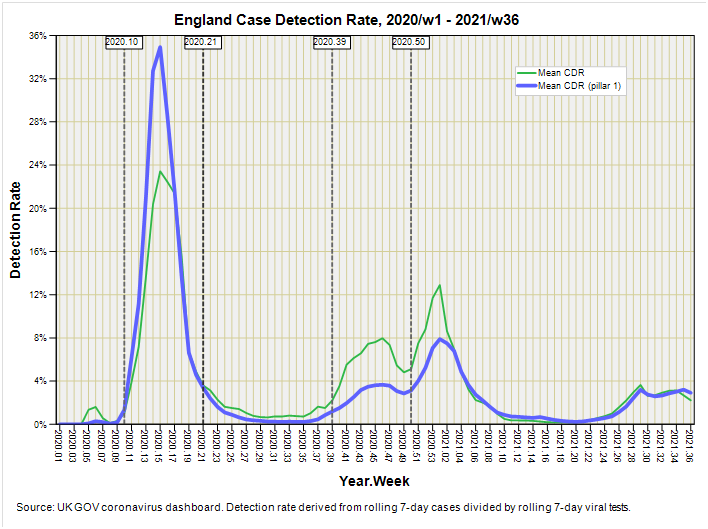
These correlations were made on aggregate data (weekly counts) so I thought it prudent to grab the individual case data and have a look at that. After a spot of cogitation I decided to whip out the trusty spanner of staged multivariate logistic regression and set the COVID diagnosis as given in the EPR as the dependent variable. In order to minimise the likelihood of false positives I opted to dice the data into two pre-vaccine periods when things were hotting-up on the disease prevalence front (or whatever that was). Here’s how that looks:
We thus have two 11-week periods spanning 2020/w10 – 2020/w21 and 2020/w39 – 2020/w50. Count-wise we’re looking at samples of 3,558 deaths for the first wave and 3,307 deaths for the second wave so I’m going to have to be prudent when it comes to using factors that splice these modest samples further.
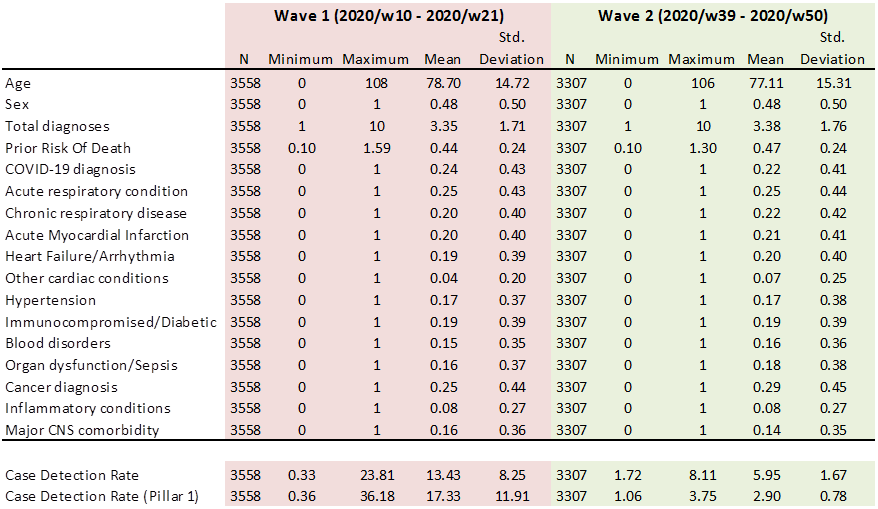
It is customary when writing a formal paper to include a table that compares basic demographics across study periods so here is a nod to convention1:
A quick eyeball down these neat and tidy rows suggests to me that we have two well-matched samples in terms of age, sex, background health status and presentation of disease; we might say it is the sorry business of death as usual. What is very different, as we may expect, is the expression of the case detection rate that was extent at the time of death. It will be interesting to see what transpires, if anything, other than slightly elevated counts for in-hospital death during the first wave.
What is rather intriguing at this point are the similar mean rates for an ICD10 COVID-19 diagnosis in the medical record, being 0.24 (24%) for the first wave and 0.22 (22%) for the second wave despite very different mean rates for my pillar 1 disease prevalence proxy, being 17.33 cases per 100 viral tests for the first wave and 2.90 cases per 100 viral tests for the second wave. A quick stab at my trusty hand-held calculator reveals an elevated likelihood of a COVID diagnosis to the tune of 5.4 times for the second wave compared to the first. We might hazard a few choice guesses as to why COVID diagnoses became so popular during the second wave.
Staged Multivariate Logistic Regression
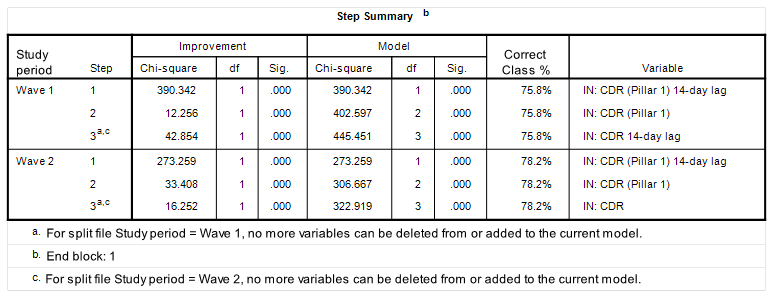
In part 2 of this series I mumbled on about using a 14-day lagged value for the pillar 1 case detection rate; an idea that seemed to bear fruit. I therefore decided to check this notion again whilst setting up the coding for the staged multivariate logistic regression in the prediction of a COVID diagnosis for both the first and second waves. This was achieved by submitting the four possible measures of disease prevalence (CDR, CDR (Pillar 1), CDR 14-day lag, CDR (Pillar 1) 14-day lag) to the model in a conditional forward selection procedure. Herewith the telling table:
What is utterly splendid is that my hunch for using the pillar 1 detection rate along with a 14-day lag proved (objectively) to be the best predictor of a COVID diagnosis prior to death for both waves. Get in there! Job done. Biscuits baked. Although other variants of this variable sneaked in note how the percentage of overall correct classification doesn’t improve.
Yer Basic Model
So now to a basic model for the demographics:
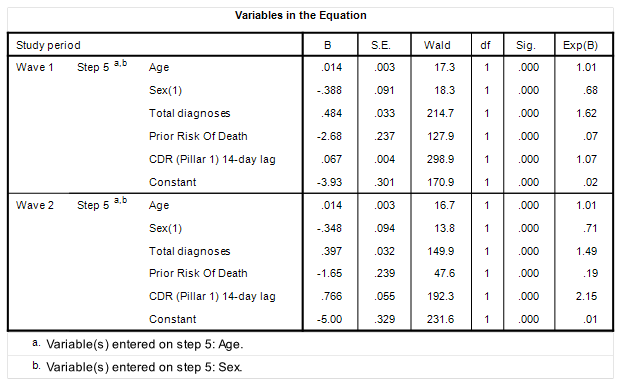
This is most pleasing for we are looking at near identical models across waves, with the exception that the risk of receiving a COVID diagnosis during the second wave in relation to CDR was higher (OR = 2.15, p<0.001) compared to the first wave (OR = 1.07, p<0.001). This pretty much mirrors what we’ve already chewed over: COVID became fashionable.
There are a couple of curious results embedded in this table. Firstly we must note the sex difference, with females apparently less likely to receive a COVID diagnosis in the first wave (OR = 0.68, p<0.001) and second wave (OR = 0.71, p<0.001). This strikes me as a bit odd, if you’ll excuse the pun, so I shall engage an Age by Sex interaction term to iron out any age-related effects that may be lurking:
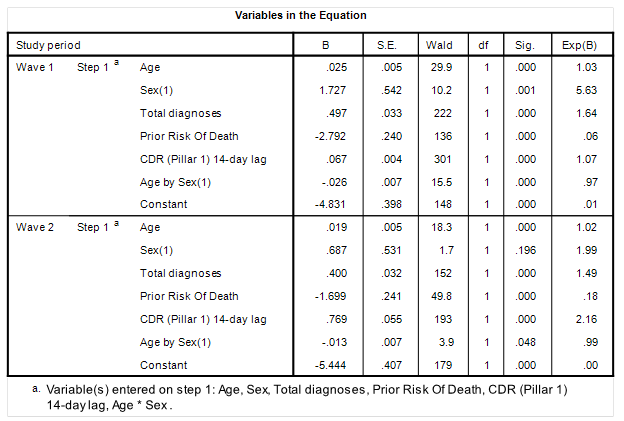
Aha! The interactive term Age by Sex (1) pops out as statistically significant for both waves and is associated with an odds ratio less than unity. Note that the main effect for Sex (1) has now swung to a whopping great odds ratio of 5.63 (p=0.001) for the first wave and a statistically insignificant 1.99 (p=0.196) for the second wave. What a head banger!
In the second wave we observe a statistically insignificant but positive main effect for Sex (1) (OR = 1.99, p=0.196) and a weak negative interaction with age that is of marginal statistical significance (OR = 0.99, p=0.048). Taken together these results suggest a weak to non-existent sex effect for the second wave that is complicated by age. In contrast in the first wave that highly significant main effect for Age alone (OR = 5.63, p=0.001) indicates a strong degree of independence; that is to say females were far more likely to have received a COVID diagnosis regardless of age.
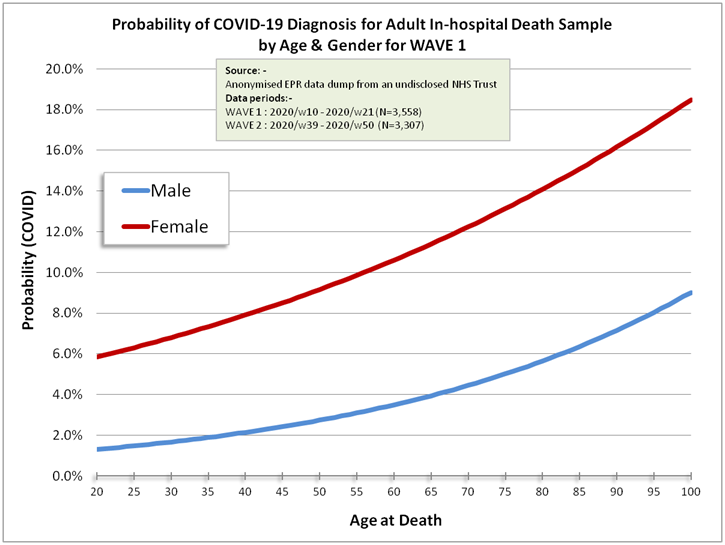
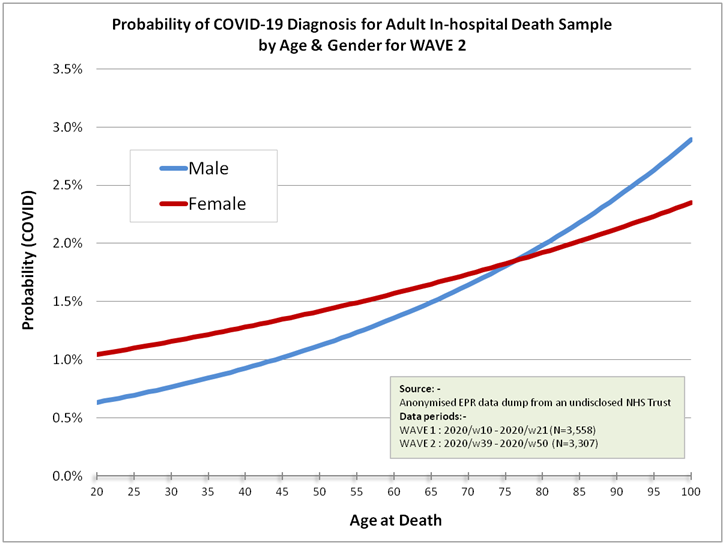
It might be best to turn these rambling words and mind-numbing coefficients into two colourful charts revealing the probability of receiving a COVID diagnosis broken down by sex for a range of ages:
How fascinating is that?! The model as it stands indicates that females of any age were far more likely to have been diagnosed with COVID compared to males during that first peculiar wave. How is this possible? How can a virus hell bent on replication within humans discriminate on the basis of sex? Obviously it can’t, so either we’re looking at sexual discrimination of some kind as regards application of the PCR test and/or clinical diagnosis or females were somehow more prone to infection either through environmental (including sociological) factors or biological factors (including medication).
Differences arising in the second wave are more believable in that males and females present largely similar probability curves, with young males at slightly lower risk and older females at slightly lower risk, with the crossover point lodged at 74 years. Note the lower overall risk compared to the first wave.
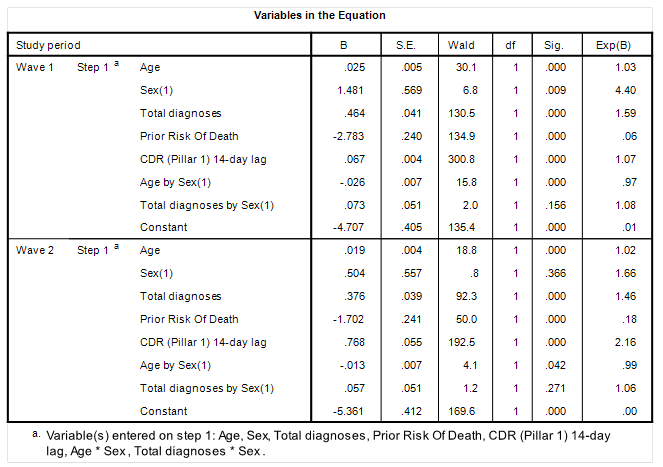
At this point some might say, “ah, but… females might have been sicker than their male counterparts during the first wave and therefore in weaker position to fend off COVID.” Let us test this hypothesis using the total number of diagnoses entered on the medical record as a proxy for general health prior to admission and death:
Well there you go! The interactive term Total diagnoses by Sex (1) fails to reach statistical significance for both the first wave (p=0.156) and the second wave (p=0.271), so general health upon admission cannot be used as an excuse as to why females were more likely to receive a COVID diagnosis during the first wave. They just were, with no obvious explanation, and in my view there’s no escaping the fact that we might be looking at some form of administrative-led discrimination unless, of course, the SARS-COV-2 virus magically favoured the conquest of females during the first wave alone for some obscure reason.
Talking of SARS-COV-2 has any laboratory managed to grab hold of a wild type as yet or are they all still conjuring sequences according to coding supplied by the Chinese? I stopped chasing that rabbit after it went down more rabbit holes than I’ve had hot dinners!
Setting basic concerns such as virus existence aside, the second curious result within the initial demographic model is the odds ratio of less than unity for Prior Risk Of Death for both the first wave (OR = 0.07, p<0.001) and second wave (OR = 0.19, p<0.001). Thus, if you were an in-patient with multiple major diagnoses (cancer, cardiac, CNS, organ failure, sepsis) you were far less likely to have been given a COVID diagnosis. There are many possible reasons for this that will hinge around patient management and care protocols but the upshot for the data analyst is that we’re wading around in a great deal of sample bias.
Stage One
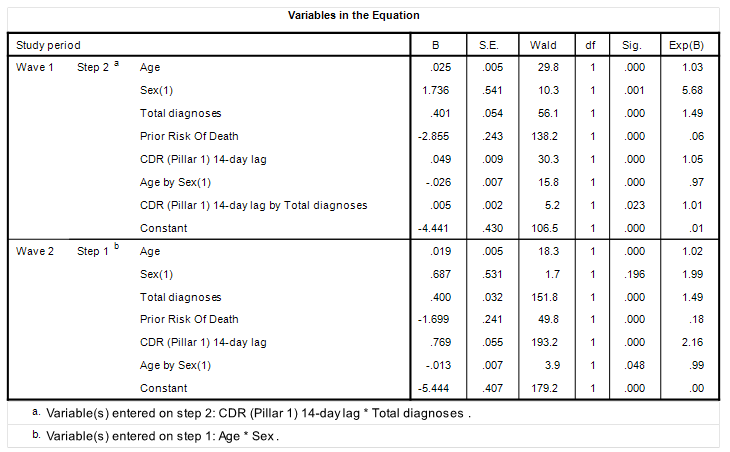
We’ve seen a couple of interactive terms at work, so at this stage in the proceedings I’d like to entertain regression model staging. In the first stage I’m going to enter the 5 main effects analysed so far to soak up the demographics as independent variables. In the second stage I’m going to submit their 10 two-way interactive terms in a conditional forward selection procedure to mop up any gravy. This is how this bake looks:
The only new term to consider is the interaction CDR (Pillar 1) 14-day lag by Total diagnoses (OR = 1.01, p=0.023). This modest refinement for the first wave alone indicates a positive association between disease prevalence and total diagnoses made with the medical record of individuals. This makes a great deal of sense and encapsulates the explosion of symptoms during periods of greater disease likelihood, though what ‘novel and deadly’ pathogen was being detected I am no longer certain: that is for the third and final model stage to decide…
Summary
Anonymised electronic patient records (EPR) of a sample of 3,558 adult in-hospital deaths over the first pandemic wave (2020/w10 - 2020/w21), together with a sample of 3,307 adult in-hospital deaths over the second pandemic wave (2020/w39 - 2020/w50) for an undisclosed NHS Trust were subject to split period staged multivariate logistic regression analysis.
The in-patient samples were well-matched in terms age, sex, background health status and presentation of disease, and differed primarily in terms of disease exposure, as expressed by the national case detection rate (COVID cases per 100 viral tests within England).
The case detection rate for the pillar 1 testing regime (those with a clinical need) at a lag of 14-days proved to be the most potent predictor of presence of an ICD10 COVID-19 diagnosis in the EPR.
The first stage of a three stage split file multivariate logistic regression in the prediction of an ICD10 COVID-19 diagnosis yielded near identical base model structure for both the first and second wave sample periods.
Females were far more likely to receive a COVID diagnosis (OR = 5.68, p=0.001) regardless of age during the first wave, this result being inexplicable. A weak and statistically insignificant sex effect was found for the second wave (OR = 1.99, p=0.196) with younger females slightly more at risk and females beyond 74 years being slightly less at risk.
Kettle On!
We should note the distinct lack of biscuity talk in formal papers, being a most disappointing shortcoming. Lead authors should at least acknowledge the reliance on biscuits during preparation of the manuscript.


Okay, from half-court in the wind:
1. Women picked their kids up from school and got it from kids, until school closures came around.
2. Women still did all the shopping and got it from other women at the grocery store while men sat around at home. After several weeks of that the women had had enough and men started sharing the shopping.
3. Women ask to be swabbed more than men who don't know how to read the news. (Or maybe they swab everyone?)
Another posibility is that women were more likely to seek treatment and thus got the diagnostic -- men were more likely to 'tough it out'. We should see this pattern for other diseases, too, if the behaviour is typical. Do we?