


Catastrophic Health Collapse (part 3)
In this article I run all cause mortality for England for 1986 – 2022 through ARIMA time series analysis

In part 1 of this series I revealed what the time series for excess all cause death for England over the period 2010/w1 – 2020/w49 looks like if we surgically remove the catastrophic health collapse (CHEC) death spike that took place 2020/w13 – 2020/w22. In terms of excessive excess we’re looking at up to 55,755 deaths that could be attributed to misguided policies over this period rather than anything genuinely viral. I refined this estimate In part 2 by standardising the data to account for England’s growing population, ending with an estimate of 53,518 deaths that likely arose from the response to COVID rather than COVID itself.
The Big Picture
Now that a form of standardisation has entered the picture we can stretch the time frame and have a look at what has been happening to the nation in terms of excess deaths over the period 1986/w1 – 2022/w46 to give the pandemic some sort of perspective. Whilst I’ve got my crayons out I might as well offer crude mortality (deaths per 100k population) until such time as I can offer age standardised excess death that dates back to 1986. I shall start with crude mortality:
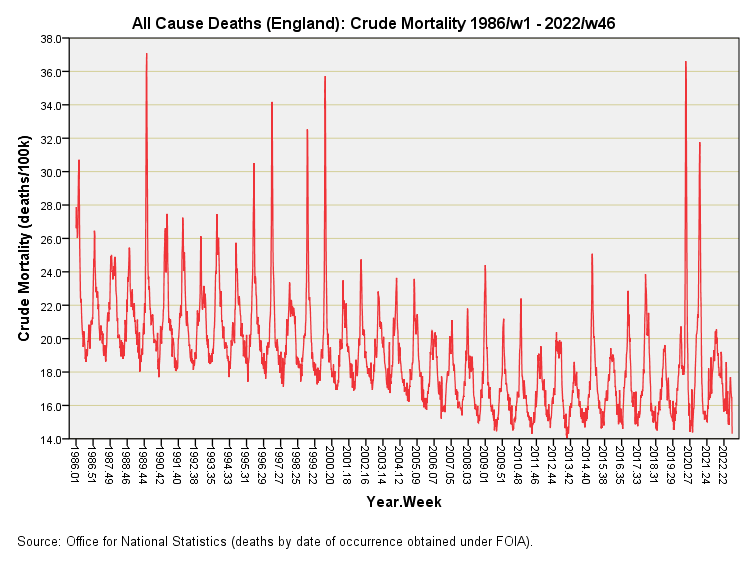
This is a rather pleasing slide. We must note that this is crude mortality and not age standardised mortality but at least it’s a start.
Back in the early days of questioning the narrative with slides like this I had one rather agitated commentator who pointed out that comparing mortality in 1986 with 2020 was pointless owing to advances in medicine. In turn I pointed out that advances in medicine were just the tip of a vast iceberg when it comes to listing changes in society that will have impinged on the health of the nation, so his point was pointless. In fact, this spiky red curve is an amalgam of all those changes and is thus a rather valuable integral of ‘all that has been’.
I suspect what irked the angry young covidian was the fact that crude mortality peaked in 1989/w51 at 37.09 weekly deaths per 100k population, with the CHEC death spike coming in second place at 36.62 deaths per 100k population. In the bronze medal position away from 1989 we have 2000/w1 at 35.72 deaths per 100k population.
If we now surgically remove the CHEC death spike then the pandemic only starts to compete with historical crude mortality during 2021/w3 (w/e 22 January 2021) with a rate of 31.76 deaths per 100k population, a figure that places it down in 12th place for all-time high since 1986. We are now into the initial stages of vaccine rollout and so we must ask whether this lesser spike is due to a seasonal pathogen, a mutated SARS-COV-2 virus or vaccine harm.
The Best The Virus Could Manage
If we consider the ‘pure pandemic’ response prior to vaccine rollout on 8 December 2020 and surgically remove the CHEC death spike period of 2020/w13 – 2020/w22, then all the novel and deadly SARS-COV-2 virus can muster (albeit in conjunction with closure of health services and draconian measures that served to decimate people and destroy the nation) is a crude mortality of 20.64 deaths per 100k population during 2020/w49 (w/e 4 December 2020), which places it right into common or garden seasonal respiratory territory.
This ‘very worst pandemic week’ prior to vaccination rollout and outside of the suspicious CHEC death spike period manages to come 623rd in a series of 2,185 weekly values for crude mortality. This is not what we’d expect from a novel and deadly virus ravaging a nation, but it is what we’d expect from something no more and no less dangerous than a typical respiratory pathogen.
A Spot of Surgery
Erase the two large spikes in the right side of this graph, and take in the big picture and you’ll start to see what I’m getting at. Without that very unusual period in the government of the nation during spring 2020 (closing services, terrifying people and silencing doctors) there’s nothing to write home about. Here’s what that slide looks like with the CHEC death spike surgically removed (observed counts for 2020/w13 – 2020/w22 replaced with prior 5-year means):