
Digging Deeper Into EudraVigilance (part 2)
Preliminary Tabulations

Data Source
This morning we’ll start straight in with a table that reveals some 77% of EudraVigilance reports to date1 have been filed by healthcare professionals…

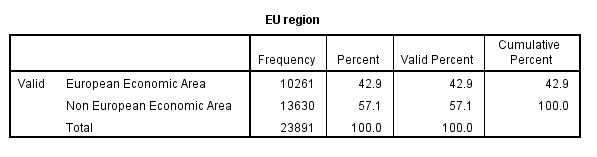
Whilst this is an encouraging start we need to assess the quality and nature of the 5,500 entries made by non healthcare professionals and compare these data records with those made by healthcare professionals in case there are some basic reporting biases that need to be addressed. As regards EU region we find slightly more reports from regions outside of the EEA (please refer to the EudraVigilance website for a listing of these).
Age & Gender
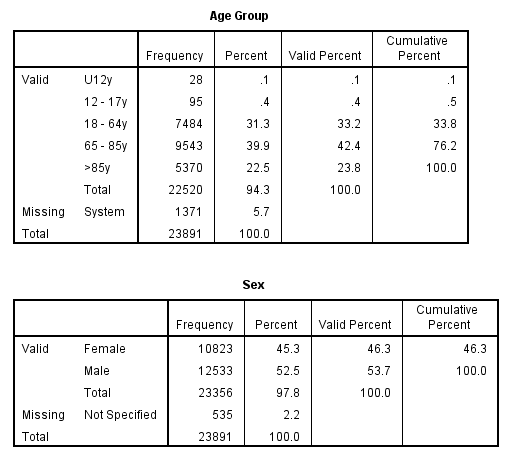
It is somewhat disappointing that EudraVigilance does not record actual age at death and, instead, lumps cases together in broad groupings. The age span of 18 - 64y is quite ridiculous and will hide all manner of pharmaceutical sin. The U12y grouping is my own concoction being a collation of 0 - 1 month, 2 months - 2 years and 3 - 11 years.
Suspected Drugs
One of the many fields generated by the EudraVigilance line report system possesses this cumbersome header:
Suspect/interacting Drug List (Drug Char - Indication PT - Action taken - [Duration - Dose - Route])
Cumbersome it may be but this handy field tells us which drugs are actually suspected and the delay between vaccination and death. The important point to note here is that the deceased may well have been in receipt of several drugs prior to death, each of which may be suspected. A quick count of drugs reported per fatality reveals a minimum of 1 (COVID vaccine alone) up to a staggering 47 drug entries (5 different drugs on a repeated schedule) for one unfortunate individual who had been receiving regular treatment for a variety of psychological disorders. Mean and median drug entries for all 23,981 fatalities were 1.2 and 1.0 records per case respectively, with 22,413/23,891 (93.8%) cases exhibiting just one drug entry. It may be prudent to exclude the 1,478 multi-drug fatalities from future analyses or treat these cases with an eye on drug interaction.
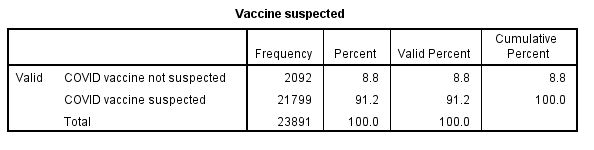
Not all COVID vaccinations were considered ‘suspect’, but the vast majority (91.2%) were, as may be gleaned from the table below. This split provides analysts with another wrinkle to iron out!
Dose to Reaction (DTR)
It is possible to extract the time lag from vaccination to the initial recorded reaction, though data entry is sloppy (no formalised time format) and sparse with just 4,362 / 23,891 valid entries (18.3%). A quick rummage reveals a minimum delay of zero days (i.e. same day reaction) up to a sizeable 313 days. Mean and median DTR were 3.4 and 1.0 days respectively, with 4,079/4,362 (92.2%) reactions occurring within 24 hours. If that is not a sobering statistic I don’t know what is.
Reaction Events
As well as pharmacological load another area worth exploring is general health, which sounds a bit daft given we are dealing with fatalities, but this will serve as a useful indicator should the scope of the study be widened to include non-fatal incidents. In this regard we can count the number of reaction entries made per fatality, there being a system limit of 60 entries. A quick count reveals a minimum of 1 entry (death) and a maximum of 60 entries for an unfortunate individual who suffered cardiac arrest with aortic aneurysm compounded by atelectasis and encephalopathy. Another point to note here is that 54 of those 60 reaction entries were flagging results of diagnostic tests (full bloods, imaging, EEG etc) as well as certain treatments (e.g. intubation), so the reaction record isn’t at all pure and reflects diagnostic work undertaken. Mean and median reaction entries for all 23,981 fatalities were 3.4 and 2.0 records per fatality respectively, with 8,637/23,891 (36.2%) cases exhibiting just one reaction record.
COVID-19 Diagnosis
The reaction event field usefully provides a means of tracking diagnosed COVID cases among the fatalities, of which 2,718/23,891 (11.4%) were categorised as such:
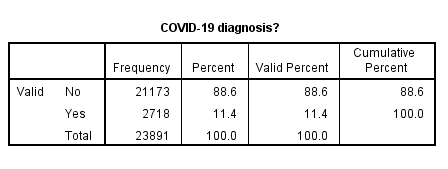
This seems a surprisingly high figure given these were vaccinated individuals: the relationship between this and other factors will be worth exploring. In the same vein (please excuse the pun!) we are also able to pull out controversial COVID treatments from the suspected drug record (e.g. Remdesivir) and analyse the data with respect to such.
I hope this modest newsletter has given a flavour of what data are available within EudraVigilance and an idea of what analyses may be wrought. As I get to grips with the dataset I shall be moving from simple tabulations to crosstabulations, slides and statistical modelling; plus there will be scope for examining trends over time. For today I suspect this will suffice by way of appetiser. Time to get the…
Kettle on!
Data sample period is 23 Dec 2020 to 28 Feb 2022.
Very interesting!
VAERS btw has many age groups exposed via the reporting engine, but the download does have actual age field populated in -90% of the reports. So, we know mortality rate per age group. The offset in days to deathi is also available for probably 90% of cases.
Interesting to see the stats on (poisoning) remdesivir "treatment". I think in US such "treatment" end up with ~30% fatalities.
Each aspect of your analysis is very interesting and truly unique!
Delighted to see you digging into this database. I am sure there will be many nuggets of information to extract.
However, unlike VAERS and the YC system, the data is being pooled from a set of nations with very different adverse effect surveillance systems.
So one avenue for investigation I would suggest you could use your expertise to explore more thoroughly is the under-reporting / over-reporting question.
A cursory inspection (using the links you kindly provided in your last missive), shows that the Netherlands has reported around 16% of the adverse effects in the Eudra database attributed to the Pfizer inoculation, yet it represents less than 4% of the population (though there are of course significant differences in inoculation rates by country). A similar observation for fatalities was reported a while back by Joel Smalley iirc.
Are the Dutch a nation of chronic hypochondriacs and/or vaccine disinformationists, or is their post-jab follow-up and reporting more thorough than other member countries?
If the latter, what does that imply for the overall figures that the Eudra system provides?