Do COVID Vaccines Work? (part 12)
I utilise data from an unknown NHS Trust in the development of a staged multivariate logistic regression model in the prediction of acute respiratory conditions
I left this series hanging in part 11 after being holed below the waterline in my attempt to analyse adult symptomatic COVID in-hospital death over the period 2021/w10 – w37. This aborted attempt followed a suggestion made in part 10, this being:
My next move is to throw away the rather ambiguous meringue of a dependent variable (COVID Dx) and replace it with Symptomatic COVID, then revise the model structure accordingly. To pull in the largest sample possible my definition of symptomatic COVID will simply be any in-patient who received both a positive test result and any respiratory diagnosis prior to death. It will be interesting to see how this simplified approach will swing things.
What all this fiddling boils down to is an attempt to address the diagnostic errors embedded in the EPR, which is supposed to flag genuinely infected and grievously ill COVID cases. Except this WHO-driven approach to diagnosis does nothing of the sort: the indicator variable COVID-19 Dx does not do what it says on the tin! Without a reliable indicator for genuine (and current) COVID infection leading to severe respiratory states prior to death we can’t say whether vaccines have been working or not. Period. Hence my digression with the three part mini-series The PCR Test As A Predictor Of Acute Respiratory Conditions.
Bias, Bias, Bias!
As in the hit song, it’s all about the bias.
What to do when swimming in bias so deep it could go on forever? Like Shirley Valentine I decided to jump off the roof of the yacht and run a statistical model so sexy that it took 66 steps to converge on a classic solution, only to be pipped at the last post by some rather boring machine learning. The multilayer perceptron method I used might sound like something out of a novel by Douglas Adams but it did the trick by furnishing predicted COVID status and an associated probability of COVID for all 19,457 deaths in the sample. Now the latter is where the magic lies for with probability scores I can now run logistic models with individualised probabilities for a genuine COVID diagnosis instead of the yes/no forced upon us by the indicator variable COVID-19 Dx. That being said, most folk like to think in terms of ‘did they have COVID or not?’ so I am going to fall back to using predicted COVID status (Probable COVID) rather than probabilities.
Individualised probabilities and the indicator variable Probable COVID derived therefrom slash through sample bias like a hot knife through butter since these variables are forged in n-dimensional space that takes account of age, sex and disease prevalence as well as 15 categories of co-morbidity, together with all possible interactions. It’s the sort of involved process that humans cannot even begin to imagine, with 37 neural nodes converging into 8 synapses that then ‘learns’ all the inherent patterns that are to be found.
Seasoned hands will realise I’m effectively talking about the development of a propensity score in the form of an unbiased risk score (probability) for COVID infection that should - if I have done my job well - minimise the error associated with false negatives as well as false positives, as well as address the inability of the PCR test (as used in practice) to flag an active infection. In plain English I’m turning the dubious quantity that is a COVID diagnosis entered on the EPR into something of clinical value. This sounds tasty but we better put such fancy fiddling to the test by attempting to predict the incidence of acute respiratory conditions once again.
Yer Model Structure
This could get unfashionably large so I did a bit of thinking and came up with this shortlist of eight primary effects:
We have met these before with the exception of Comorbidity. This is an indicator variable that identifies deaths with a significant comorbidity other than respiratory. Thus, we are looking at cardiac, cancer, diabetes, hypertension, neurological and so on. I could, if I had the time, resort to modelling umpteen comorbidities in their own right but such a model will get breathtakingly complex and extremely cumbersome to build and run, with sample sizes dwindling into crumbs. I thus opted for this quick fix just to soak up some of the variance. As may be seen from that column of means some 85% of adult in-hospital deaths carried a significant diagnosis other than respiratory.
Whilst we’re eyeballing that column we might as well note the mean value of 0.10 for deaths that were construed as Probable COVID. IMHO this is not an unreasonable figure, suggesting that 10% of in-hospital deaths over the period March 2020 – Sep 2021 were associated with or caused by COVID.
All in all, eight main effects will give us 28 two-way interactions and 56 three-way interactions. After tugging on my beard for a while I decided to limit the structure to two-way interactions to avoid dwindling sample sizes and to keep some clarity. Three-way interactions in the prediction of a dependent variable is effectively demanding we get our head round a four-way interaction; a task that I find mind-numbing even after 39 years in the stats business! Two-way it shall be, then.
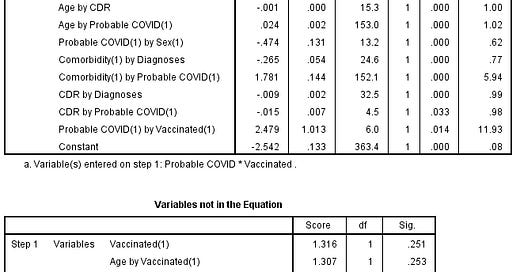
One other feature worth mentioning is that the vaccination main effect was entered (forced) into to model at stage 2 with the vaccination interaction terms submitted via conditional forward selection at stage 3, this allowing all the standard demogs to soak up as much background variance as possible in the prediction of acute respiratory conditions prior to death. Here’s the resulting table of model coefficients:
Food For Thought
These tables are food for thought in a slap-up feast sort of way. If we forget the vaccination terms for a moment and look for odds ratios greater than unity then we find Sex (OR = 3.30, p<0.001), Chronic respiratory disease (OR = 1.62, p<0.001), total number of Diagnoses (OR = 3.21, p<0.001), case detection rate – CDR (OR =1.09, p<0.001), Age by comorbidity (OR = 1.04, p<0.001), Age by Probable COVID (OR = 1.03, p<0.001), and Comorbidity by Probable COVID (OR = 5.93, p<0.001) all coming out in the wash as being associated with elevated risk of an acute respiratory condition.
These make a great deal of sense (though the greater risk for females is a surprise) and largely reflect what is being said in the literature as well as social and legacy media. The bruiser here is Comorbidity by Probable COVID that whacks the likelihood of acute respiratory conditions up by six fold. In plain English, if you are suffering from a major non-respiratory comorbidity and manage to contract genuine COVID, then you are likely heading for critical care. On this I am sure we can all agree.
What we are not going to all agree on is what the vaccination terms indicate. Six of the seven possible interactions fail to make it to statistical significance, which keeps things splendidly simple. I shall remind readers that odds ratios greater than unity are indicative of potential vaccine harm, whereas odds ratios less than unity are indicative of potential vaccine benefit.
Baddie At The Bottom
We might as well kick off discussion with the largest odds ratio on display for Probable COVID by Vaccinated (OR = 11.26, p=0.017). I would argue that this is the single most important term in this model because this is the term that links vaccination status to COVID status to acute respiratory conditions. What this term is saying is that genuine/symptomatic COVID in-patients prior to death were 11 times more likely to suffer an acute respiratory condition if they were vaccinated. I shall suggest the word is WOWSER! Phrases such as ‘Holy frying mother of sweet crêpes’ also spring to mind, but this will not come as a surprise to anybody with fewer relatives on their Christmas card list this year.
No other interactive vaccination terms make it through to statistical significance at the 95% level of confidence. This is rather interesting for it suggests vaccine harm is restricted to inducing COVID-like symptoms if things go wrong. We should note the statistically insignificant main effect: Vaccinated (OR = 1.06, p=0.251). The magical elixir that was claimed to bring benefit in many ways (including reduction in cancer and car accidents) is not magical after all, with sample bias associated with COVID test results bringing about the illusion of benefit. Whoops.
Record Keeping
These shocking results get me thinking about the quality of record-keeping. Anecdotal reports from the coal face indicate that not all patient records are cross-matched for vaccination status as diligently they should be, with some professionals confiding that the system is a total farce. We’ve been here before with positive test results leading us up the garden path, and here we are again questioning the validity of vaccination status within the EPR. I’m well aware of failure to register inpatients as vaccinated if their condition deteriorates rapidly and this alone would explain the substantial bias we are seeing.
Bizarrely, then, I need to start thinking about ways of adjusting for vaccination status error prior to modelling; this not being a new thing and is a matter that has been championed by Professors Norman Fenton and Martin Neil of QMUL. The good news is that my modelling strategy, as it currently stands, has gone and clobbered a hefty source of bias that is the driver behind false claims of vaccine benefit. This is a sensational numerical turnaround because back in Do COVID vaccines Work? (part 10) we last saw Vaccinated popping up with an odds ratio of OR = 0.08 (p<0.001), indicating a thirteen-fold reduction in the likelihood of a positive test result for the vaccinated cohort. This is what sample bias can do and it’s not pretty!
We now see just how illusory that spectacular result was, for it evaporated once we started questioning the veracity of COVID-19 diagnoses lodged in the EPR. How much more illusion will fade away if we start questioning the veracity of vaccination status prior to death?
Summary
The variable COVID-19 Dx, as derived from the diagnostic fields of the EPR, is not a reliable indicator of genuine disease status.
Machine learning was employed to build a probabilistic model of likely disease status (Probable COVID).
Staged multivariate logistic regression for the prediction of onset of acute respiratory conditions for 19,457 in-patient deaths was undertaken.
Probable COVID cases were 11 times more likely to suffer an acute respiratory condition if they were vaccinated (OR = 11.26, p=0.017).
Vaccination as a generalised (main) effect failed to reach statistical significance (OR = 1.06, p=0.251).
Use of probable COVID-19 disease status eliminated a major source of bias that had hitherto given rise to the illusion of blanket vaccine benefit.
Kettle On!
Good work, John Dee! When you're done, I have 8 years of death certificate data you will definitely be interested to delve into.
That is just brilliant work. The way you work the reader through the explanation is outstanding. It helps that my bias is it’s all about the vaccine harm. Can’t imagine your kettle is ever off.
Might have to share this, well the headline at least, with some of the mutton crew on Twitter that have significant cognitive bias at play. And of course they would never pay to receive access to actual facts.