Emergency Department Admissions: Analysis of CDS Dataset (part 1)
I analyse an anonymised data dump of 1.9 million admissions records to the emergency departments of an undisclosed NHS Trust for the period June 2017 – September 2021
Well now, this is all très excitant: plein de muffins chauds arriveront bientôt! As many of you know I was handed an anonymised data dump back in September 2021 that provided all manner of very handy diagnostic information culled from the EPR of an undisclosed and rather sizeable NHS Trust. Up to now my focus has been on the in-hospital death side of things but as from today I’m going to flip my fryer and have a look at people who were still alive at the point of admission to an emergency department. I like to call this ‘front door’ medicine.
These days there is a more comprehensive dataset to be had with the advent of the Emergency Care Data Set (ECDS) that was first rolled out in 2021. We’re now on release 4.0 of that data set and keen readers can find both details and the history behind these data sets at this link. Here’s the sub-header from the landing page:
The Emergency Care Data Set (ECDS) is the national data set for urgent and emergency care. It replaced Accident and Emergency Commissioning Data Set (CDS type 010) and was implemented through: ECDS (CDS 6.2.2 Type 011 and subsequent releases). The latest version of the data set is ECDS v4.0.
ECDS allows NHS England to provide information to support the care provided in emergency departments by including the data items needed to understand capacity and demand and help improve patient care.
Please note that bit where it says ECDS replaced the accident and emergency commissioning data set CDS type 010 because the older data dump I have in my possession - that runs from 2017 through to 2021 - is an extract from that earlier coding framework. As you’ll soon see CDS type 0101 was rather a crude coding affair, and the issues are neatly summarised in this two minute YT clip. Fortunately I was also given a small slice of the more sophisticated ECDS coding framework for the period January 2021 – September 2021 and I’ll squeeze whatever I can out of this at a later stage.
As some of you full well know front door medicine is a different beast from all other medicine with different pressures, different targets, and different approaches in a very different environment. I remember my first visit to my A&E as a suited allied healthcare professional to talk with the lead consultant. A guy was screaming in resus as they pushed drains into his chest cavity, the ambulance crew were trying to clean a blood-stained stretcher and a very tall drunken fellow with a nasty head wound was threatening everybody including the desk staff. I made the mistake of popping to the public toilet to come face-to-face with a drug dealer trading substances in the first cubicle. In the next cubicle a prostitute offered her services. And then some kind nurse whispered the code to the staff toilet. My hat is permanently off to those with the physical, mental and emotional stamina to provide these services.
One thing I learned working with A&E was that speed was essential to life. Not just in nailing a diagnosis, pumping drugs, staunching wounds and inserting lines but in getting folk in a sorry state out to diagnostic services and, ideally, away to the wards asap. A stagnant A&E brings death (and the wrath of suited senior managers desiring to meet targets). Success didn’t come from form-filling and neat coding but from keeping someone alive. With this in mind let us now step over the vomit and go and meet some real world data…
The Basics
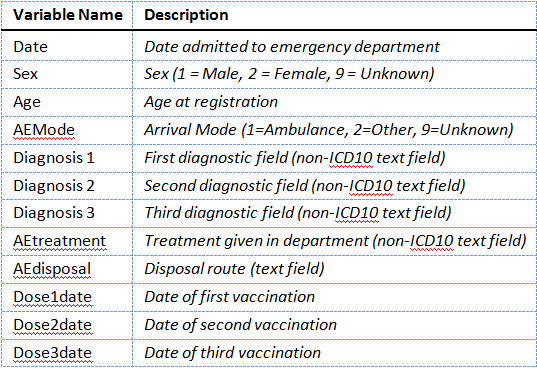
The CDS type 010 data extract I have sitting on my screen right now spans 1 January 2017 – 19 September 2021, there being 1,928,918 entries. Please note that an entry represents a visit to A&E such that somebody in a bad way health-wise might be represented in the database ten or more times over this period. Because the data are fully anonymised I have no way of converting visits to unique persons and this limitation needs to be born in mind for certain analyses. For example, diabetics are likely to require the services of A&E more so than those with arthritis and so will be over-represented in comparison. As for the raw data fields handed to me there are just 12, these being:
Some readers will note reliance on non-ICD10 text fields and wince. This isn’t as bad as it sounds because we’re talking drop-downs and not free text fields, which would have been horrendous to analyse. Fortunately I have a natty module within my stats package that automatically converts string values to coded values at the press of a button, and this opens the door to all manner of re-coding and analysis. By way of example, coded text fields for the variable AEtreatment ran from ‘[1] Active rewarming’ through to ‘[102] Wound closure – wound glue’, whilst coded text fields for AEdisposal ran from ’[1] Admitted to hospital’ through to ‘[12] Transferred’. I shall be digging into these fields as we go.
Data Quality
Missing data is always a bug-bear for data analysts and must be expected in A&E perhaps more so than any other department. In this regard age information was missing for a mere 18 of the 1,928,918 entries, this representing a data capture rate of 99.999%, which is nothing short of astonishing. Sex didn’t fare quite so well with this information missing for 1,674 data entries, this representing a data capture rate of 99.9%, which is still pretty mind-blowing. Hats off to the desk clerks!
A&E staff had no idea how 24,585 folk managed to arrive for treatment, this representing a data capture rate of 98.7%, though this isn’t exactly surprising if the person they’re dealing with is unconscious and has been dumped on the doorstep. Yes, that happens. Assessing the data capture rate for treatment is tricky since this field will have been left blank if no treatment has been given. There is a drop-down for no treatment, the exact wording being ‘None (consider guidance/advice option)’ but in the real world this option isn’t always recorded, especially if the patient is quickly trolleyed through to specialist services and/or diagnostics elsewhere. The bottom line is that 266,523 records possessed blank treatment fields, this representing 13.8% of the database. The good news here is that clerical staff were much better at recording where a patient ended-up, with only 32,271 records possessing blank disposal fields, this representing a data capture rate of 98.3%. ‘Disposal’ is such an unpleasant word to use but that’s the jargon!
Apart from shifting people about and offering treatment, A&E staff are in the business of diagnosing and doing this at lightning speed (think triage on steroids). In this regard the primary diagnostic field was missing for some 208,261 entries, this representing 10.8% of the total database. Again, we can’t pin this on oversight and sloppiness of the clerks because diagnoses are sometimes made elsewhere, for example in specialist units and diagnostic suites. In my old unit category 1 cardiac cases spent seconds in A&E before zipping over to cardiology.
At this point we should note there is a text drop-down for ‘Nothing abnormal detected’, which will be used if a patient is given the all clear and told to go home, but a busy clerk isn’t going to be fiddling with a coding screen if they can help it.
So there you go, we can’t expect miracles at the sharp end of medicine but what data we do have is invaluable. I guess I better pop the kettle on, rummage in the biscuit tin and start to produce some slides and tables!
Key Diagnoses
So here’s the shock horror – the CDS type 010 dataset does not code for COVID-19. Excuse me while I chew my elbow. We can attempt to circumvent this by coding for respiratory conditions and infectious diseases. This means we can use these three drop-down text fields:
Respiratory conditions
Respiratory conditions - bronchial asthma
Respiratory conditions - other non-asthma
And these three drop-down text fields:
Infectious disease
Infectious disease - non-notifiable disease
Infectious disease - notifiable disease
…to create case indicator variables. We may then combine these indicators to look for cases with a respiratory diagnosis as well as an infectious disease. These broad-brush cases will include anything and everything we might label as an influenza-like illness (ILI) as well as the mystery that came to be called ‘COVID’.
But diagnosis is only half of the picture. We have a record of treatment carried out within the emergency department so can shortlist those treatments that are likely to be wheeled out for respiratory illness as well as the mystery called ‘COVID’. Here’s my shortlist, with the net thrown as wide as possible:
Arterial line
Central line
Chest drain
CPAP
Intravenous cannula
Intubation & Endotracheal tubes
Lung punction
Nasal airway
Nebuliser/spacer
Observation/electrocardiogram, pulse oximetry
Oral airway
Other Parenteral drugs
Other Parenteral drugs - intravenous drug
Other Parenteral drugs - intravenous infusion
Recall/x-ray review
Recording vital signs
Supplement oxygen
With an indicator variable established for likely treatments of ILI/COVID we can go one further and combine this with the diagnostic raft for respiratory and infectious disease to nail those admissions to the emergency department that exhibit all the right signs and features; cases that smell of the COVID thing and were treated accordingly.
Service Provision
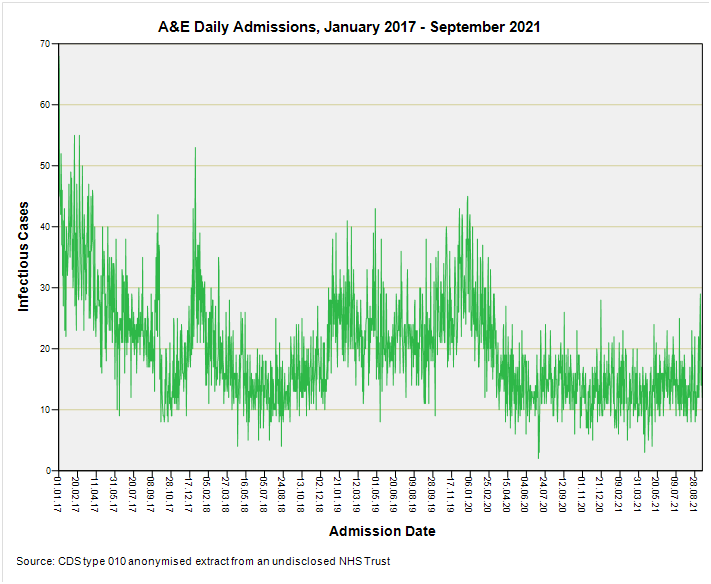
For my first tray bake I thought I ought to take those 1,928,918 individual records and convert them to daily counts so we can get a feel for service demand over the period January 2017 – September 2021. Brace yourself, bite a biscuit, and here we jolly well go:
Holy mackerel in spicy tomato sauce, Batman! I think we can see why ambulances were queuing up empty outside emergency departments to pose for the TV cameras and why hospital staff had time to rehearse those slick dances for Tik Tok.
In the space of a few days this Trust went from handling 1,200 – 1,300 emergency admissions per day to around 500. That’s a lot of tea and biscuit time too for those who like to stuff carbs. What it also is - if we think about it - is an impulse to the healthcare system that is going to cause havoc down the line. My eyeballs suggest that things got back to ‘normal’ round about May 2021, so the public were under the boot of those suited executives for nigh on 13 months.
Respiratory Cases
I’m going to guess at this point that you’ll want to see the time series for respiratory admissions, so here it is:
How’s that for a shocker? Peak daily admissions for respiratory conditions were achieved on 26 December 2019 with 251 admitted cases, though we can clearly see the situation was building before this, with more than 200 such cases per day appearing as early as 24 November 2019.
During this period my wife’s school got hit by a mystery illness that was flu-like in nature causing fever, loss of smell, loss of taste, and a dry cough (among other things). Older staff got truly clobbered and were absent for several weeks. I succumbed on 6 December and took 13 weeks to recover, with my toes and feet going blotchy purple at one point. A coincidence, maybe? Similar stories of the ‘worst flu ever’ can be told by many residents in these parts.
Does this sound familiar to you? I’m going to guess that many UK residents are able to tell a similar story of something nasty that hit the population before the government and their sponsors rolled out a carefully-crafted pandemic.
Infectious Diseases
So how about the incidence of infectious diseases? Try this for size:
Can anyone spot the pandemic of 2020? I certainly can’t, and what’s more my monkey mind is wondering why infectious diseases don’t feature from 2020 onward as much as they did before the carefully-crafted pandemic was unleashed. That tail end is a bit quiet, don’t you think?
Treatment
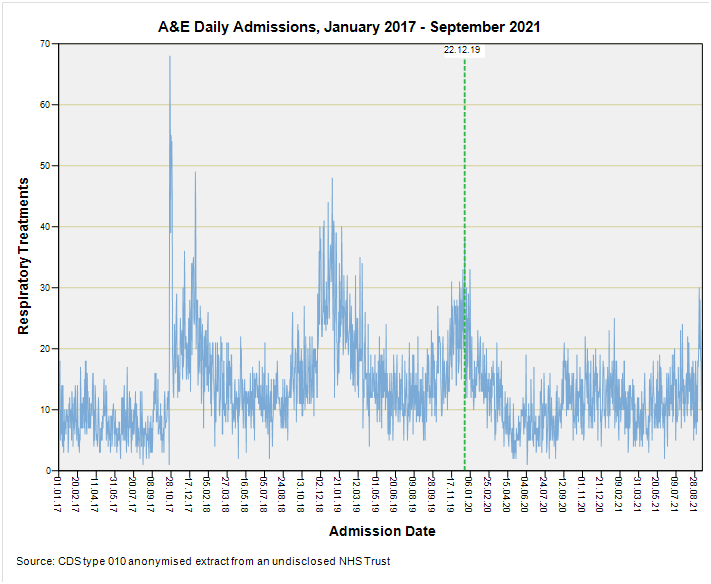
So how about we count the number of admissions requiring treatment for respiratory conditions? This will be stuff like CPAP, intubation, endotracheal tube, nebuliser, and supplemental oxygen. Here’s the daily count once again:
Another shocker with history beating the pandemic period hands down. The best near-pandemic peak we observe occurred on 22 December 2019 with 38 admissions requiring a respiratory procedure on a single day.
What About Those ILI/COVID Indicators?
There’s simply not enough of these cases to display on a daily basis so I’m going to present these as weekly counts in the next article in this series. This fact alone is worth cogitating on, and another thing we must cogitate on is that the meltdown in emergency service provision is going to bend the numbers like crazy. What we’ll need to do, therefore, is ogle a set of slides for the percentage of respiratory/infectious cases amongst all admissions in case this flushes out a swing that might be indicative of a respiratory pandemic. Straight bat and all that.
I’ve no idea what I’ll find until I press those buttons but what I do know is that I crave a nice pot of tea…
Kettle On!


Thanks John for your continued dedication. I'm of the view that PANDA have articulated quite well: mostly what spread in the "pandemic" was the PCR and antigen testing regime, with a tsunami of false positives flowing from the testing regime and, due to defining a "case" simply as a test positive almost for the first time in history, a flood of "cases." There was of course also an actual illness but it's prevalence as you've shown was nothing compared to the flood of false posiitve "cases."
Yes, we all succumbed to that mystery Xmas 2019 spike in this household too. It was rampant - but we didn't need medical attention. Hard to believe it was unrelated to Covid, and makes one wonder what on earth was happening at national level where you would have thought they would have detected it under the flu vigilance programmes.
All the usual symptoms of a heavy cold/ mild flu with some very odd taste sensations that resulted in my and my wife loathing the taste of wine for a week or two (shock horror)! and even juicier, both quitting smoking - permanently - and with zero effort - because it just tasted perfectly horrid. I still can't stand the smell of tobacco breath.