Emergency Department Admissions: Analysis of ECDS Dataset (part 1)
I analyse an anonymised ECDS data dump of 237k adult admissions records to the emergency departments of an undisclosed UK NHS Trust for the period January – September 2021
Back on May 6, in part 1 of a 13 part series entitled Emergency Department Admissions: Analysis of CDS Dataset, I promised to flip my fryer and have a look at people who were sufficiently alive to make it through the doors of emergency departments of an unknown NHS Trust over the period January 2017 – September 2021. I mentioned the development of a superior dataset to the old CDS 010, this being the Emergency Care Data Set (ECDS) that was first rolled out in January 2021. We’re now on release 4.0 of the new data set and keen readers can find both details and the history behind these data sets at this link. Here’s the sub-header from the landing page once again:
The Emergency Care Data Set (ECDS) is the national data set for urgent and emergency care. It replaced Accident and Emergency Commissioning Data Set (CDS type 010) and was implemented through: ECDS (CDS 6.2.2 Type 011 and subsequent releases). The latest version of the data set is ECDS v4.0.
ECDS allows NHS England to provide information to support the care provided in emergency departments by including the data items needed to understand capacity and demand and help improve patient care.
The old CDS type 010 was rather a crude framework, and the coding issues are summarised in this two minute YT clip. I’ve done my best to squeeze the juice out of this in a series of 17 articles these past few months and shall now turn my attention to the ECDS data spanning January 2021 – September 2021.
TBH there’s not a great deal of fancy additional data in the funky new ECDS dataset but it does offer improved precision with diagnostic fields, there being three allocated per record as with the CDS dataset. Back with the CDS dataset I had 69 differing diagnoses to consider whereas with the ECDS I face a giddy 884 unique diagnoses – from Abdominal aortic aneurysm to Yaws - among which we find “COVID-19” – now there’s handy!
Another improvement is additional of a field called ‘Chief Complaint’, of which there were 140 unique entries. This is the primary reason why folk made their way to the ED and I’m sure you can see how valuable this field is going to be for we can identify all those making their way because of intoxication and/or knife wounds only to be given an additional diagnosis of COVID-19 as the result of a dodgy PCR test. The authorities shouldn’t have been calling these ‘COVID cases’ as such but you all know the game that was played inside-out by now!
So let me begin at the beginning…
Some Basics
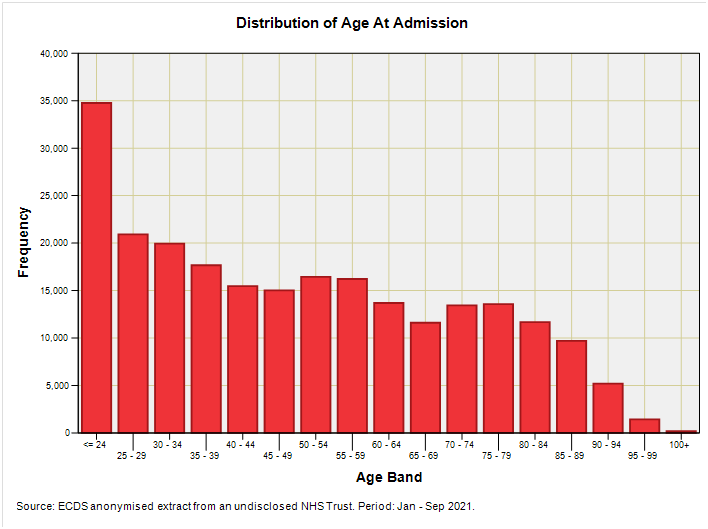
I’ve got 236,856 adult admissions in the ECDS database for the period 1 January 2021 – 24 September 2021 of which 51.6% were female. Summary stats for age at admission are as follows:
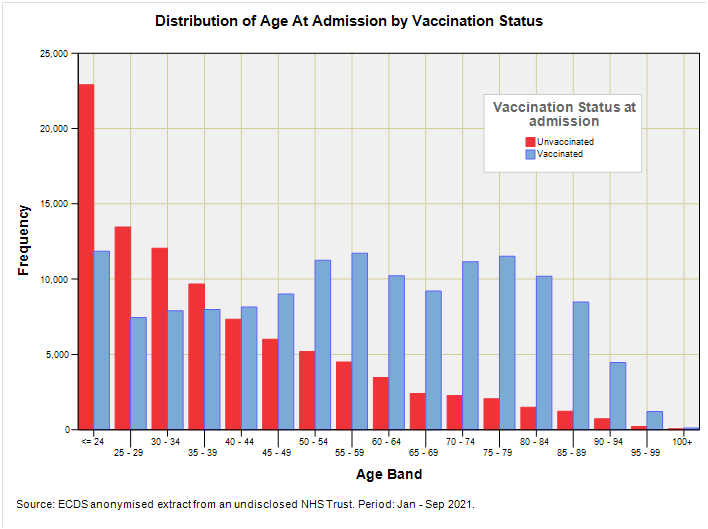
As I have said many times before front door medicine is young person’s medicine (or similar words to that effect). I’m sure many folk will want to know how many of these were vaccinated, so here’s the slide again broken down by vaccination status at admission:
There’s nothing strange going on here given the age prioritised rollout – we shall have to wait until I can turn the handle on staged multivariate logistic regression with propensity adjustment before we can start saying anything about vaccine harm. At this stage what might be arguably more informative is a plot of the percentage of vaccinated ED admissions by decadal age band by month so we can judge the progression of vaccine rollout over the first nine months:
What we have here is a veritable chicken and egg since we don’t know if the rising tide of admissions is due to mounting vaccine harm or mounting number of injections (or both). It also remains to be seen how representative ED admission vaccinees are of the population in general. Whilst we are mulling over what can and cannot be sensibly said about vaccines in retrospect using the ECDS data at this superficial level we can go on to do something vaguely cunning and that is to look at the distribution of reasons for ED attendance for vaccinated and non-vaccinated folk using the ECDS chief complaint data field…
Chief Complaint
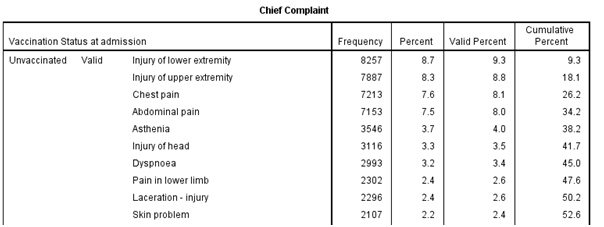
Here’s the listing of the ten most popular chief complaints for unvaccinated admissions in descending order of incidence:
And here’s the top ten listing for vaccinated admissions:
Ok, so chief complaints have swapped around by a couple of places or so but what I’m essentially looking at is pretty much the same top ten listing for both cohorts. In case anybody leaps on ‘headache’ for the vaccinated cohort as a sign of something possibly different going on please bear in mind that headache crops up in eleventh place for the unvaccinated cohort. Scanning the full listing with cuppa in hand didn’t reveal anything worthy of cogitation either so I shall turn to the awkward question of COVID – what was COVID supposed to be?
The COVID Question
With chief complaint on admission in our pocket along with a specifically declared COVID diagnosis we can make inroads into unravelling the COVID question. To kick this off I scanned the entire listing for chief complaint and flagged those conditions that were broadly commensurate with a flu-like illness. Herewith my shortlist of COVID-compatible chief complaints:
Asthenia
Chest pain
Cough
Cyanosis
Difficulty breathing
Dyspnoea
Fever
Haemoptysis
Headache
Hospital admission, emergency, direct
Nasal congestion
Numbness
Respiratory arrest
Sore throat symptom
Stridor
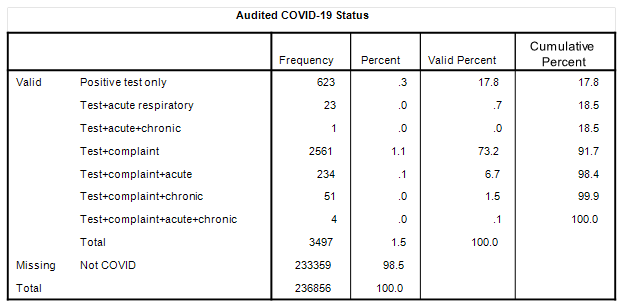
In addition to this handling of chief complaint, all respiratory diagnoses were classified as either acute (e.g. pneumonia) or chronic (e.g. asthma). This jiggery pokery gave a total of nine possible scenarios, eight of which are tabulated below:
The missing scenario is for a positive test result with a chronic respiratory diagnosis (Test+chronic) of which there were none.
The topline figure for COVID admissions is that puny 1.5%; this representing 3,497 positive-testing admissions out of a total of 236,856 ED admissions. If we now look at the Valid Percent column we get to see the percentage breakdown for those 3,497 positive-testing admissions. Leading the pack by a very long way is Test+complaint at 73.2% of all COVID ‘cases’, these being folk who arrived with a COVID-compatible complaint who went on to produce a positive test result.
When it comes to the crunch (people in a bad way) then we’ve got that 6.7% for Test+complaint+acute, that 1.5% for Test+complaint+chronic, and 0.1% for Test+complaint+acute+chronic, making a total of 8.3% for symptomatically sick positive-testing COVID admissions. In the grand scheme of things this only represents 1.2% of all ED admissions.
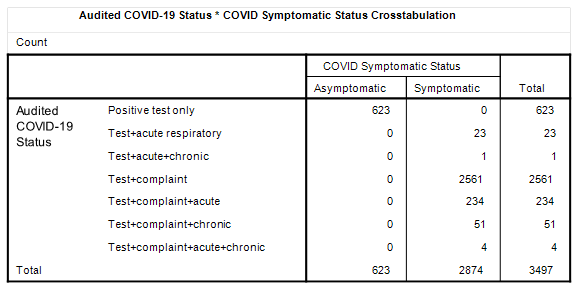
If we were to tidy this up by considering asymptomatic vs. symptomatic status then we get the following bake:
Thus, we might estimate an asymptomatic ‘caseload’ of 17.8% of all positive-testing admissions, though this is not exactly a caseload! The identification and management of asymptomatic cases is not unlike somebody setting up a contract cleaning service for the Emperor’s new clothes. But… we can take it a step further by looking at treatment.
Treatment of COVID Cases
Within the ECDS dataset we have three fields allocated for the capture of procedures undertaken in the ED, and a squizz at these reveals 77 unique entries for each, ranging from Active warming of patient to Transfusion of blood product, the most popular treatment being patient given written advice (25.5% of responses, 43.7% of cases) followed by cardiac monitor surveillance (12.3% of responses, 21.1% of cases) and administration of medication (9.3% of responses, 15.9% of cases).
In terms of the range of treatments that would be offered to those suffering from COVID-like symptoms (i.e. flu symptoms) we may identify 24 specific treatments within the ECDS dataset that include oxygen therapy, administration of intravenous drugs, intravenous antibiotic therapy, cardiac monitor surveillance, non-invasive ventilation and insertion of endotracheal tube; that is to say I’ve thrown the net pretty wide. Herewith a cross-tabulation of appropriate treatment against COVID diagnosis for admissions during the period January – September 2021:
Well, now, there’s an interesting result right there! It would appear that just over two thirds of designated COVID cases received a treatment within the ED that was commensurate with the flu-like nature of the illness. So let us bring down that breakdown for symptomatic vs. asymptomatic COVID admissions and see how that looks:
Now that is darned fascinating for there appears to be little difference between treatment rates for asymptomatic (62.3%) and symptomatic (68.4%) COVID and this begs a rather big question… given asymptomatic COVID admissions were not exhibiting any signs of respiratory illness how come they were subject to procedures commensurate with a respiratory illness?
I suspect I have thrown my net too wide and shall gather it in a little for the next article!
Kettle On!


