Emergency Department Admissions: Analysis of CDS Dataset (part 2)
I analyse an anonymised data dump of 1.9 million admissions records to the emergency departments of an undisclosed NHS Trust for the period June 2017 – September 2021
In part 1 of this series I ended by promising a look at the weekly counts of my ILI/COVID case indicators along with conversion of the raw daily counts into percentages for respiratory and/or infectious admissions. I’ve got a fresh cuppa to hand so let’s get stuck straight in…
ILI/COVID Weekly Counts
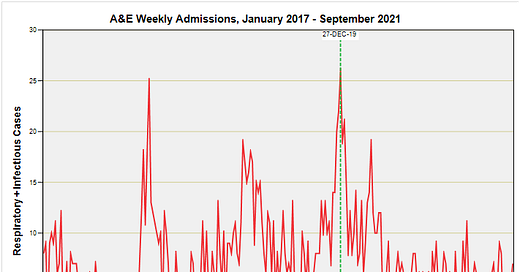
Here’s what we get when we flag infectious cases with a respiratory diagnosis:
The big peak here are those 26 cases for the week ending 27 December 2019, and it’s worth noting the earlier peak of 25 cases for the week ending 26 January 2018. Yes indeed, there is a modest spike marking 19 cases for the week ending 19 April 2020 which could be attributed to COVID (or something else masquerading as COVID). I don’t know about you, dear readers, but I certainly don’t get a sense of a novel and deadly pandemic.
If we combine incidence of a respiratory diagnosis, incidence of an infectious disease, and incidence of treatments typically employed for respiratory conditions we arrive at my probable ILI…


