
Emergency Department Admissions: Analysis of CDS Dataset (part 9)
I analyse an anonymised data dump of 1.9 million admissions records to the emergency departments of an undisclosed NHS Trust for the period June 2017 – September 2021

Back in part 6 I baked a slide that attracted some interesting comments, this being a dual time series plot of admissions to the emergency department (ED) against in-hospital deaths. We noted that when daily admissions fell through the floor then daily deaths went through the roof. Though alarming it’s tricky to fathom just what is going on here so I decided to refine this analysis by plotting weekly admissions to the ED alongside weekly deaths in the ED. Try this…

OK, so we don’t have the same situation. There’s no peak in departmental deaths when the admissions count drops during national lockdown. We may conclude that it was other people doing the dying elsewhere in the hospital: they weren’t coming in through the front door as critically ill cases.
To get a better handle on the matter I thought we ought to squint at a scatterplot of weekly ED departmental deaths against weekly in-hospital deaths for the period January 2017 – December 2020 and colourise the data cloud into pre-pandemic and pandemic periods. What we get is extremely interesting:
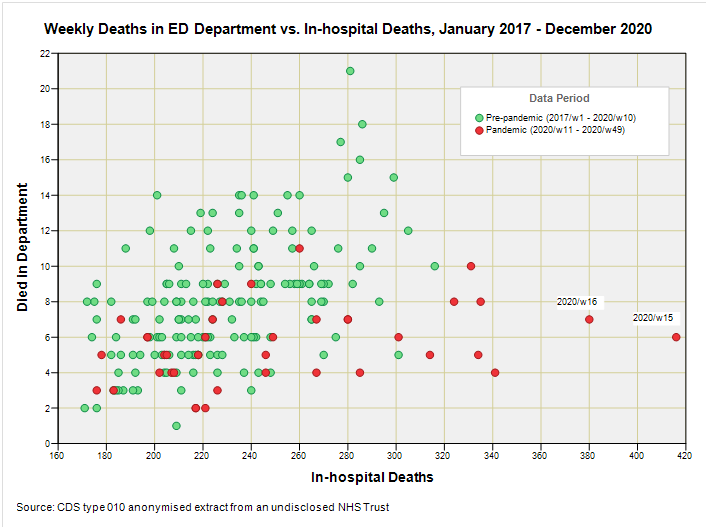
Our eyeballs will likely be drawn to the two outliers marking 2020/w15 (w/e 10 April 2020) and 2020/w16 (w/e 17 April 2020) that reveal an enormous number of in-hospital deaths compared to deaths in the department. We’re talking around 400 in-hospital deaths per 6 department deaths, this giving us a rough ratio of 66.7. Outside of these two extraordinary weeks we’ve got around 260 in-hospital deaths per 8 ED deaths, this giving us a rough ratio of 32.5. So what the heck was happening in the rest of the hospital to have that many folk die in such a short space of time?
Let me now open the analysis out to the period 2017/w1 – 2021/w37 and re-plot the points with the post-vaccine era included:
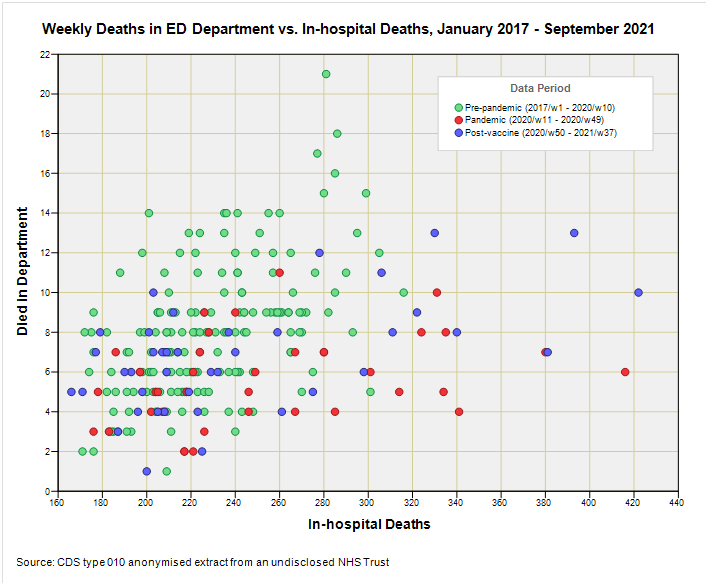
Three more outliers now join the inexplicably high death ratio these being 2021/w2, 2021/w3 and 2021/w4 covering the period 9 January – 29 January. Given we’re looking at a data cloud of 246 weekly counts that takes us through four flu seasons we may well ask why two weeks during lockdown and three weeks immediately after vaccine rollout stand out as outliers in terms of the ratio of in-hospital to ED deaths. My money is on inappropriate clinical protocols/patient management followed by vaccine harm. In a word iatrogenesis.
If I now don my furry hat of statistical modelling and break out the spanner that is generalised linear modelling (GLM), then prior to the pandemic a regression model based on the assumption of Poisson error yielded a slope rate of 4.88 in-hospital deaths per ED death (p<0.001, 95%CI[3.63;6.14]), whereas in the pandemic period GLM modelling yielded a slope rate of 9.20 in-hospital deaths per ED death (p=0.029, 95%CI[0.96;17.43]). The slope rate for the post-vaccine period was estimated at 12.26 in-hospital deaths per ED death (p<0.001, 95%CI[6.22;18.30]). It’s worth asking why the greatest slope rate is observed for the post-vaccination period given the experimental gene therapy was supposed to be safe and effective.
Coffee & Cogitation
I rather like this analysis because by regressing in-hospital deaths on the weekly count of deaths within the emergency department I’m effectively accounting for trends in the general health of the surrounding public. Outbreaks of vicious pathogens will figure in both numerator and denominator though, of course, we’re only talking about crude approximations based on total weekly counts, and we’re ignoring what happens when sick folk become incarcerated. Still, these biases and more will be present across all three periods though, as we know, hospitals changed how they went about doing things during the scamdemic. That being said there’s no excuse for a difference in rates between the pandemic and post-vaccine periods, surely!
Sober analysts will point to the wide confidence intervals for the three slopes and suggest that they are not statistically different. As crabby as this sounds I have to agree! Whilst the kettle boils once more I shall run a few quick and dirty summary t-tests to discover the only significant difference to be found that passes muster is between the pre-pandemic and post-vaccine periods, and here is the table showing this:
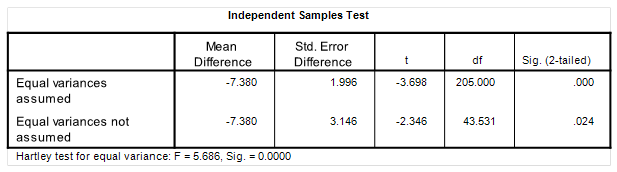
Note the Hartley test returns a whopping great p<0.001 so we can’t assume equal variances (as our eyeballs will already have informed us), which means the best we can do is lean on a p-value of p=0.024. Not a stunning result, and something to put in the fridge maybe. Well, the kettle has boiled so I’m going to stop for a cuppa before churning out more time series plots.
Kettle On!
I presume you can look into the causes of death of the outliers? And compare to the rest of the pack. And do you have a list of the changes in hospital procedures over this period that might have caused any iatrogenesis?