
Hunting For Vaccine Benefit (part 6)
Using UK GOV Coronavirus Dashboard & NHS England Hospital Activity Data And Keeping It Plain And Simple

In part 5 of this series I took a look at hospital admissions and inpatients testing positive for COVID in relation to dosing for service providers in NHS England using a technique called cross-correlation analysis. This revealed a complex picture in which vaccine harm and vaccine benefit were both evident as likely genuine phenomena as well as artefact arising from highly periodic time series. The analytical traps are deep indeed! This morning I shall continue this work by looking at bed use; data and definitions for which may be found here.
General & MV Bed Use
Herewith two slides revealing daily general and mechanical ventilation (MV) bed use for patients testing positive (a.k.a. ‘COVID cases’) for the period Mar 2020 - Jul 2022. I shall remind subscribers once again that a positive test result does not infer a clinical case proper even though the authorities like to call them COVID cases. A positive test result does not tell us whether a person is symptomatic or whether they are, in fact, carrying any virus (false positive). Neither can a positive test result tell us whether a so-called ‘COVID case’ is actually in hospital for treatment of COVID-like symptoms or something else entirely (e.g. hip replacement).
A window cleaner who fell off a ladder will count as a COVID bed if they happen to test positive on admission or at any point during their stay. If they require intensive care because of non-COVID respiratory complication they’ll also count as a COVID MV bed.
One other wrinkle to note in relation to MV bed use is that the MV function is not always used, neither are MV beds always occupied by respiratory cases. Premium beds like these in high dependency and critical care units are always in short supply, which is why we’d sometimes find a kidney case from general surgery wheeled over to one of the cardiac intensive care beds in my unit. That always ruffled feathers!
With this string of caveats in mind, let’s look at the data:
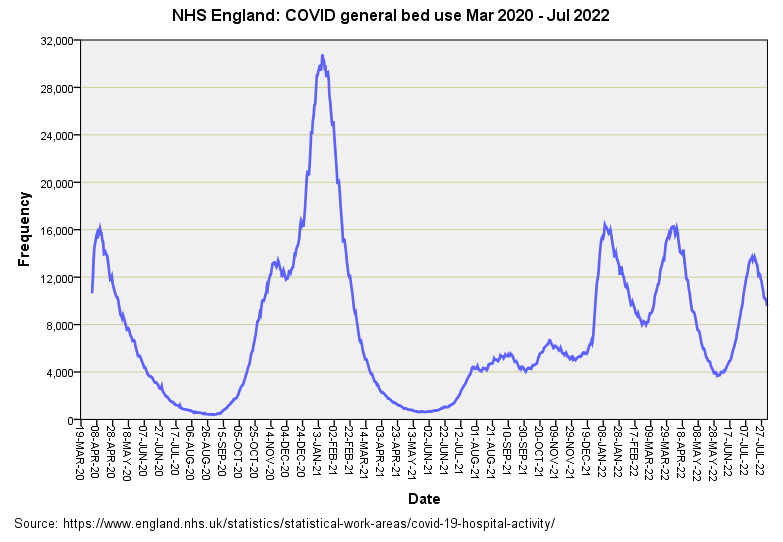
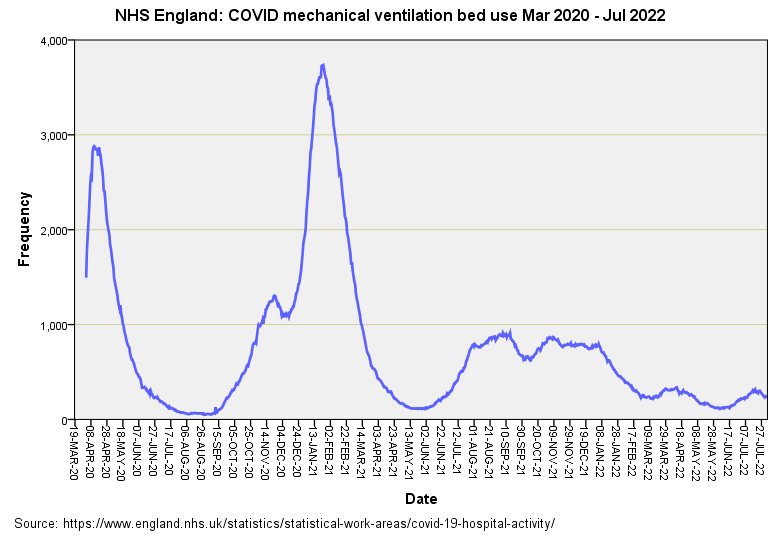
There’s nothing new here; bed use is simply mirroring admissions, which are mirroring detected cases within the population. What is worth noting is the lack of the ‘triple humper’ for MV beds for Jan 2022 onward. Not only that but MV bed use for COVID also slides toward oblivion in recent months. Some folk will argue that this is proof of vaccine benefit but we better check that claim before swallowing it whole!
Checking The Claim
If we cogitate long enough we come to the realisation that decreased MV bed use for COVID cases could indeed be proof of vaccine benefit. At the same time it could be proof of changes in bed management, proof of changes in treatment protocol, proof of changes in testing regime (and cycle threshold), proof of changes in prophylaxis within primary care, proof of effective new drugs and proof of viral mutation into less potent strains. I’m sure we can add to this list but it should be sufficient to make the point that unless we account for all of these factors and more then we can’t say anything sensible about vaccine efficacy.
One modest slide I can bake with ease is to look at the ratio of MV to general bed use for COVID cases over time, this being a ratio that will embrace all of these possibilities and more (building herd immunity, for instance):
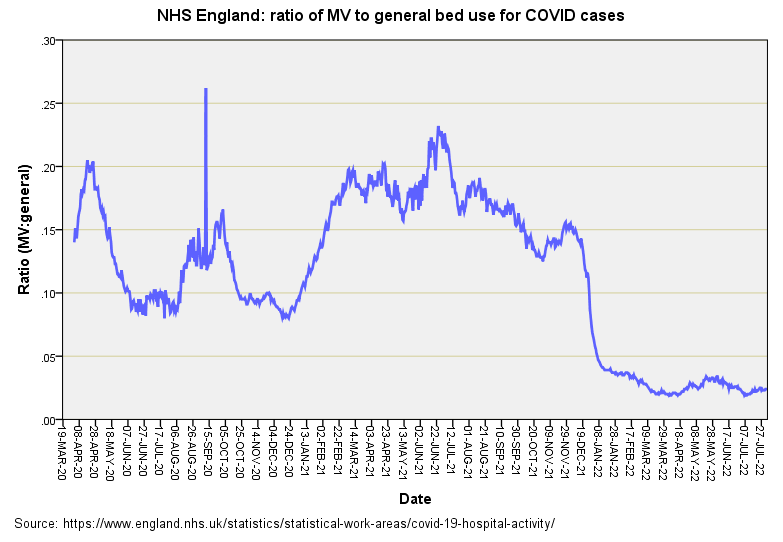
This is utterly fascinating. No doubt some will immediately leap on that peculiar spike on 11 Sep 2020. I’ve checked the source files and suspect an error in the MV bed count for COVID cases. On 10 Sep this was 62 for all of England, on 12 Sep it was 70 but on 11 Sep it leapt to 129. Working my way through the spreadsheet I discovered 67 of those beds marked ‘East of England’, which we may compare with London’s 15. Of those 67 no less than 66 were assigned to Cambridgeshire and Peterborough NHS Foundation Trust. I think not!
Setting that spurious spike aside things seem to bob about the same mean level until we reach Jan 2022 when MV bed use for COVID cases falls off a cliff . Viruses don’t do the cliff thing; neither do vaccines for that matter. Changes in testing, treatment and bed management policy certainly do, and we may wonder if a circular was issued at this point advising against MV bed use. Something like that. Thus, we almost certainly have a non-medical cause underlying changes in MV bed use for COVID that is driving the numbers to give an impression of vaccine benefit.
Whilst we are considering the cliff drop down to what is likely to be illusory benefit we ought to consider the climb up after roll-out began on 8 Dec 2020. That steady climb toward greater reliance on MV beds for COVID cases doesn’t look like a policy change to me. If we followed the fashion these days and hid our integrity in the closet we could claim this is evidence of vaccine harm but, being brought up proper, I’d have to point out that this is a steady climb into the seasonal peak for intensive care units across the nation for both COVID and non-COVID cases. So yes, it may be evidence of vaccine harm but if so it will be harm mixed with a decent helping of seasonal illness. But let’s see what those CCF plots tell us…
CCF Results
Dose 1
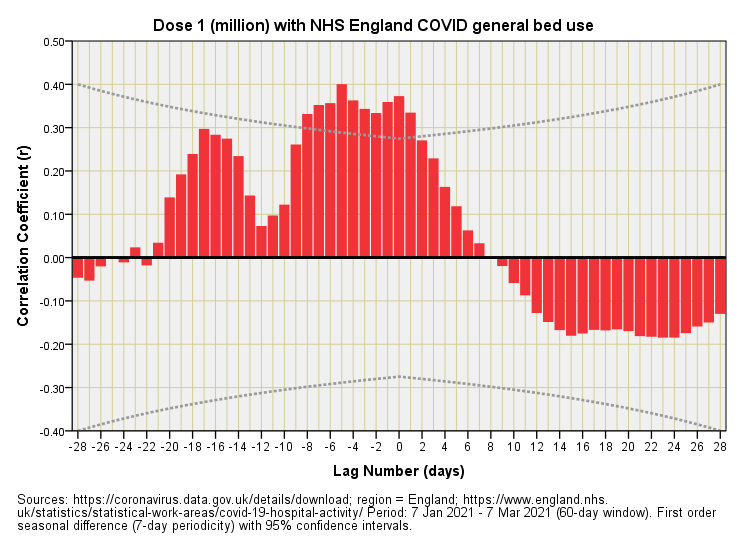
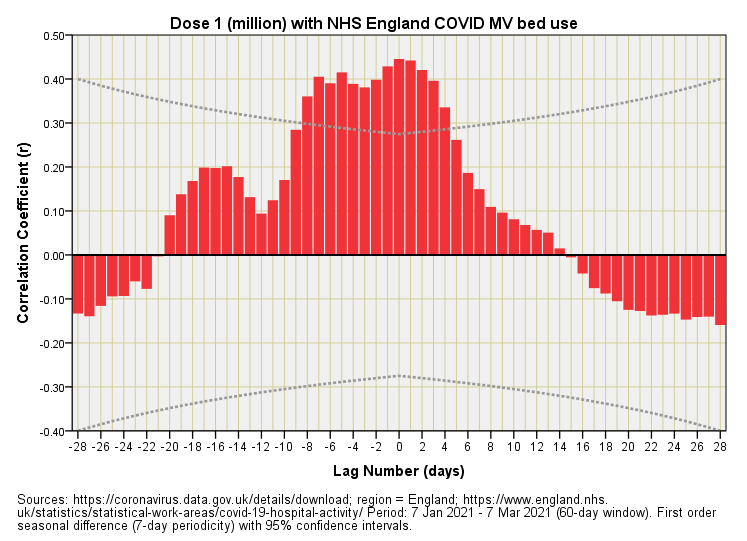
We observe a statistically significant palisade of positive correlations at negative lags for general bed use by positive-testing folk. Vaccine harm cannot be retrospective so what must be happening here is that folk were coming into hospital with COVID or were already in hospital when they tested positive for COVID prior to a surge in initial vaccination. The two positive correlations at zero lag and +1 day are suggestive of vaccine harm but it’s clear that these are part of a bigger dynamic and thus illusory. Whilst there is a hint of vaccine benefit within 28 days (negative correlations at positive lags) these correlations fail to reach statistical significance and could easily have arisen by chance.
A similar picture emerges for MV bed use but this time the key dynamic is wider, with 5 bars reaching statistical significance at zero or positive lags. If there is genuine vaccine harm occurring, and these cases are in need of MV beds within a few days of inoculation, then this situation will be superimposed on those coming into hospital with COVID or inpatients testing positive prior to a surge in vaccination. Imagine baking a cake then trying to separate the flour from the eggs; this is the formidable task that all analysts face.
Dose 2
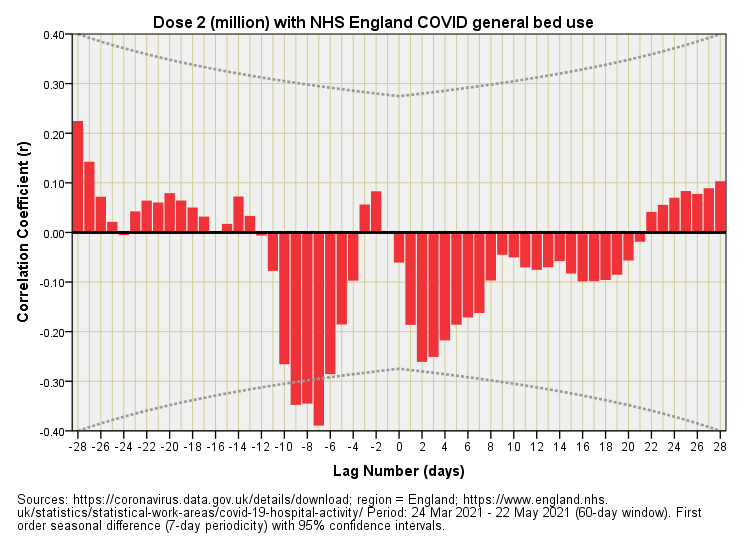

Here we have a totally different scenario, which is fascinating in itself. There are a few statistically significant negative correlations for general bed use that are indicative of vaccine benefit but they occur at negative lags of around 1 week. It’s impossible to have benefit before the jab so something else must be going on. What we’re seeing here is a decline in general bed use for COVID cases a week or so before a surge in secondary dosing. Yep, another illusion! It’s worth noting that this illusion will crop up as an apparent benefit in official tables and reports that lump periods together.
This time round the dynamic for MV bed use doesn’t resemble general bed use, and nothing pops up as being statistically significant. There are suggestions of vaccine benefit within a week and again around the 2 week mark but my money is on these being yet more artefact.
Dose 3
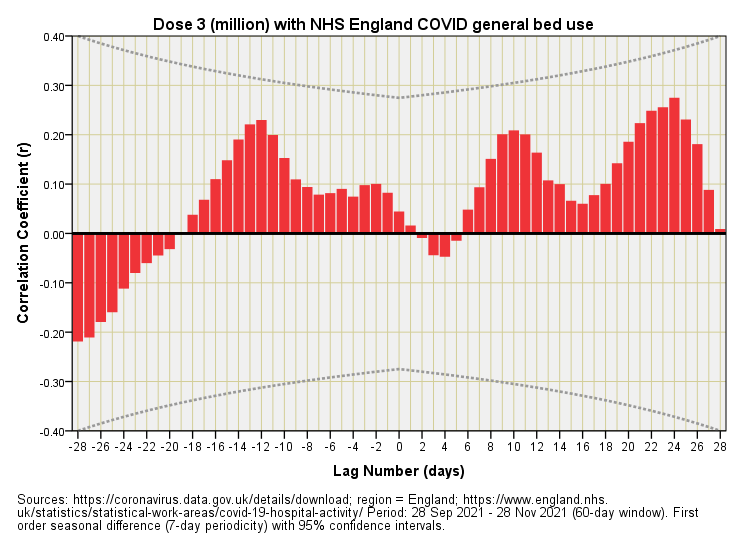
And something different yet again! No sign of statistically significant correlations for general bed use and hints of vaccine harm that fall into the artefact category. Yes, there are peaks suggesting harm around +10 days and +23 days but there are also peaks doing the same around -12 days. We can’t grab one in preference because it fits our story and ignore the other unless we are being dishonest and claim we can revert a cake back to eggs and flour.
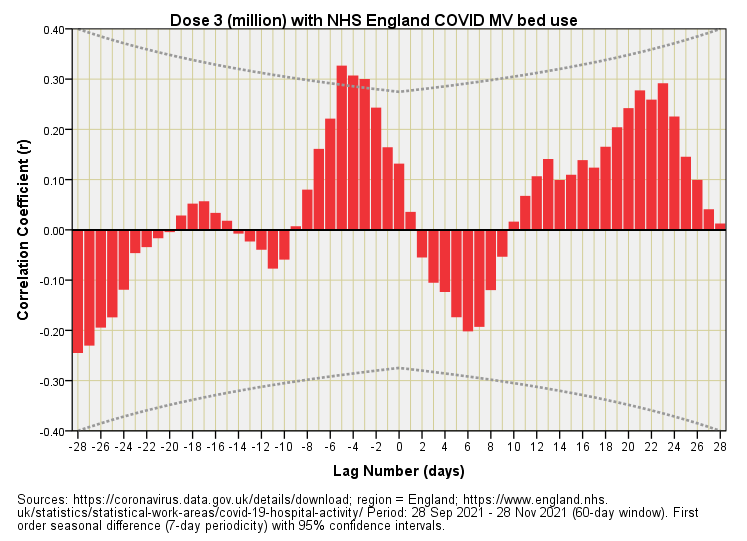
Just to drive this point home the plot for MV beds throws up statistically significant correlations at lags of -3, -4 and -5 days. Retrospective harm is impossible so hospitalisation of very sick folk who tested positive must have surged before a surge in booster jabs.
What Have We Learned?
I am hoping we have learned that none of this is easy to unravel and that layers of different things happening all at once essentially lead to ambiguity in the data record. Ideally the authorities would come clean and admit to this but don’t hold your breath. We have gathered data on a national scale on an issue of paramount importance such that anybody can claim anything yet it all mean nothing.
Kettle On!
Interesting set of articles - thank you.
At some point, would you consider writing a precise article covering the conclusions of this work and your previous works on vax effect from EPR?
I have a question regarding CCF. In signal transmission and echo location applications, the input signal ideally would have a really sharp ACF. So chirp or pseudo random binary sequences are used.
In this case, the input signal is vax doses and I suspect that its ACF is not sharp but spread over time.
Would it be useful to look at Rxx of the doses so we would have some idea of the 'sharpness' of signal to be expected in the CCF if there is causal relationship between the input (doses) and output (beds etc)?
Are the numbers available for Scotland N.I. and Wales? And do they all tell the same story? ISTR seeing a graph of N.I. excess deaths being “normal” over the COVID period, and thought that there should be some investigation/explanation forthcoming.