
Missing Deaths Exploration (part 2)
Weekly all cause death figures published by the Office for National Statistics do not stand up to scrutiny. The evidence indicates we are missing a bunch of young deaths.

In part 1 of this series I extended the work of Joel Smalley who has been piling on the FOI and lashing cash over at the fabulous Dead Man Talking substack in order to get a better handle of weekly all cause death in England & Wales. There is a phenomenon I am calling ‘Joel’s holes’ whereby we seem to be missing a whole pile of younger deaths that goes back for the best part of a year.
The spicy explanation for this is that the ONS are hiding these deaths but my money is on a more prosaic explanation of a system that doesn’t cut the mustard during dynamic epochs. Officers I’ve engaged with have all been very helpful and advise me on not relying too much on data that is less than 6 months old owing to administrative inertia. A handbrake for all this is the delay incurred through involvement of the coroner, since what a coroner says goes and the ONS can’t process a death until the coroners have spoken. All eyes on the forthcoming Chief Coroner’s report, then, whose last annual report is dated 5 Nov 2020.
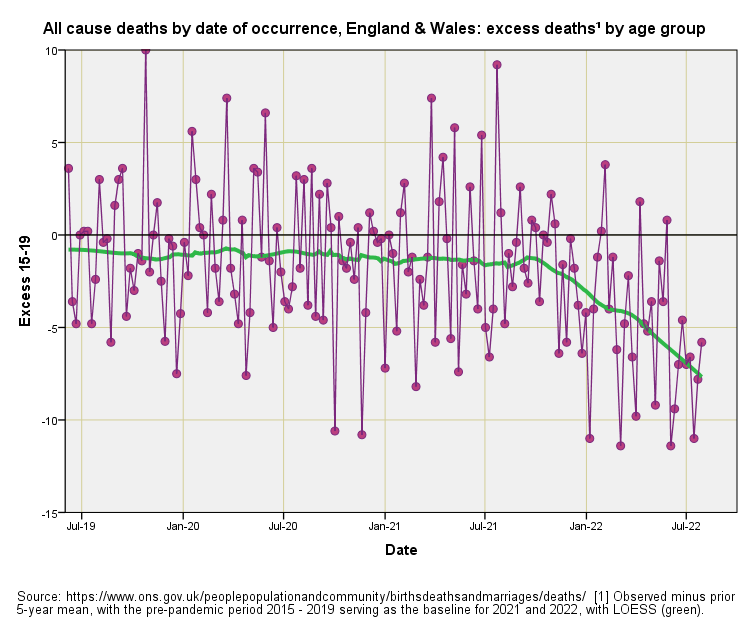
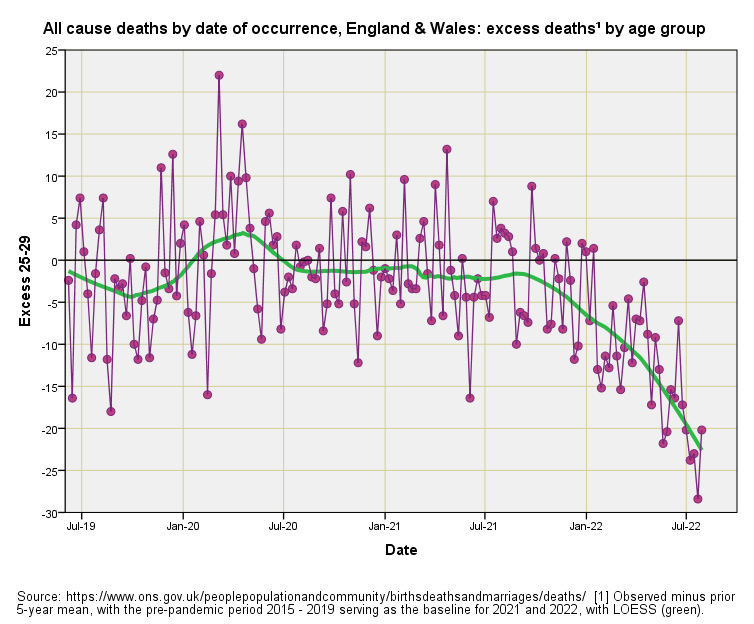
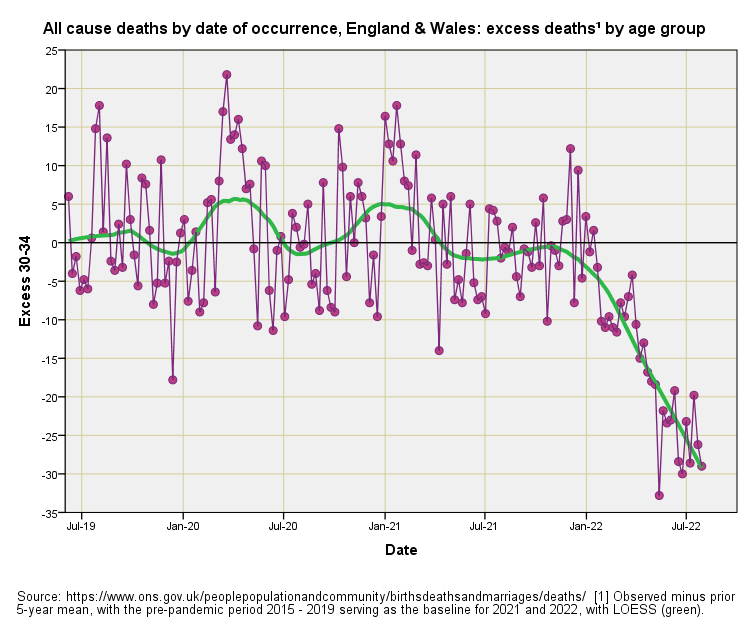
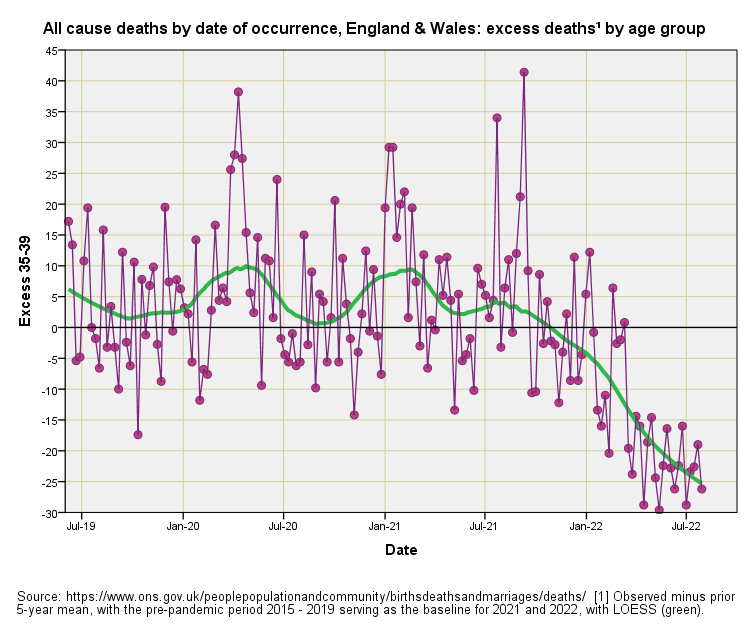
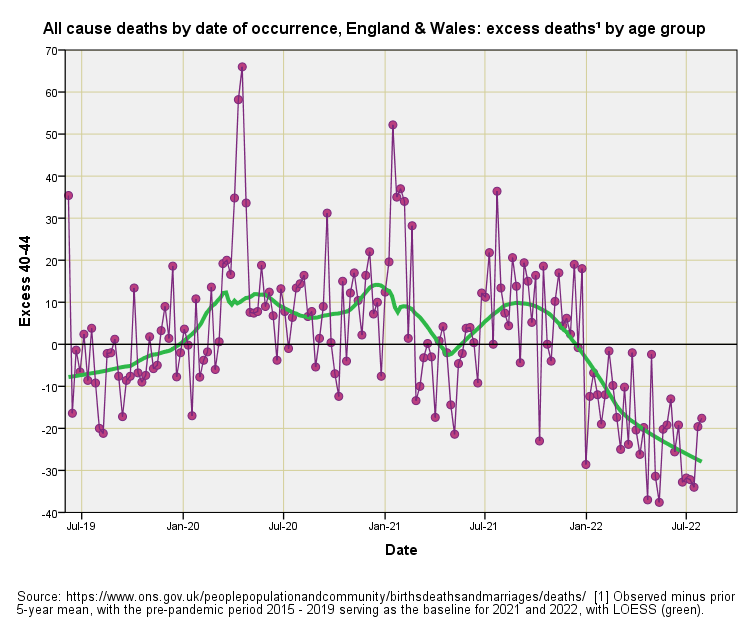
Meanwhile, I have derived excess all cause deaths by date of death (DOD) using Joel’s FOI data and using the ONS standard method of subtracting prior 5-year means for each of the 20 quinary age groups. I now present them as an uninterrupted breakfast feast that should be self-explanatory save for a locally-estimated scatterplot smoothing function (LOESS), this being depicted by a green wiggly line that guides the eye.
Fresh From The Oven - first batch
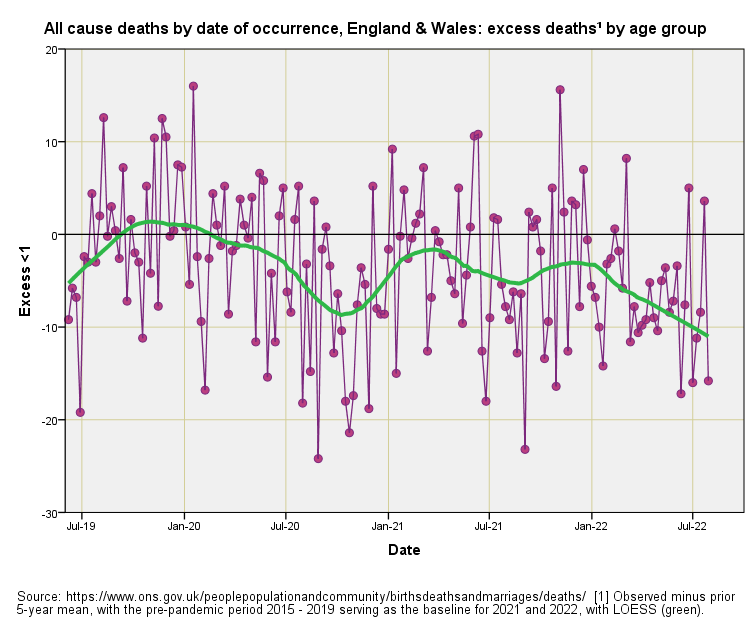
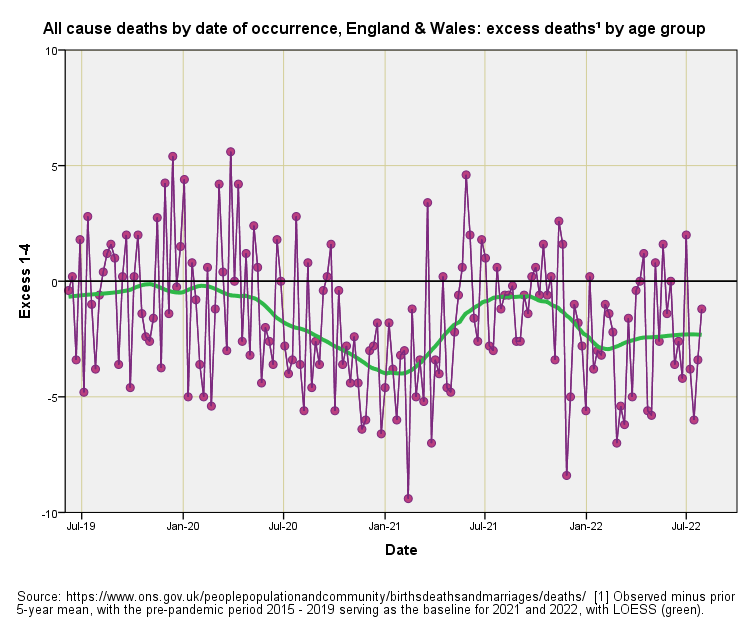
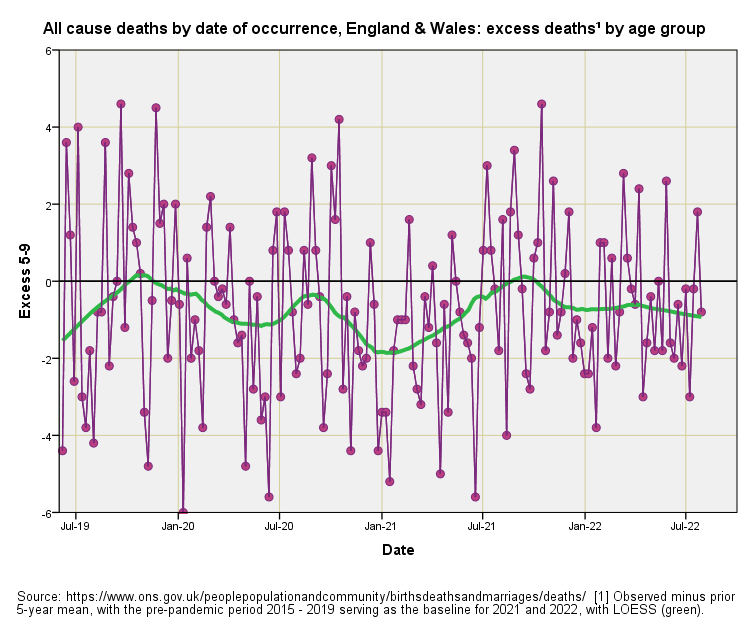
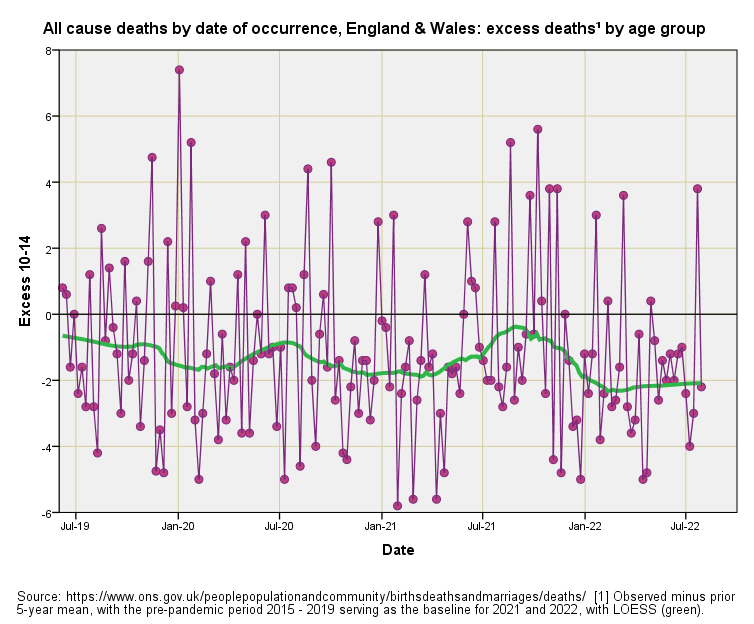
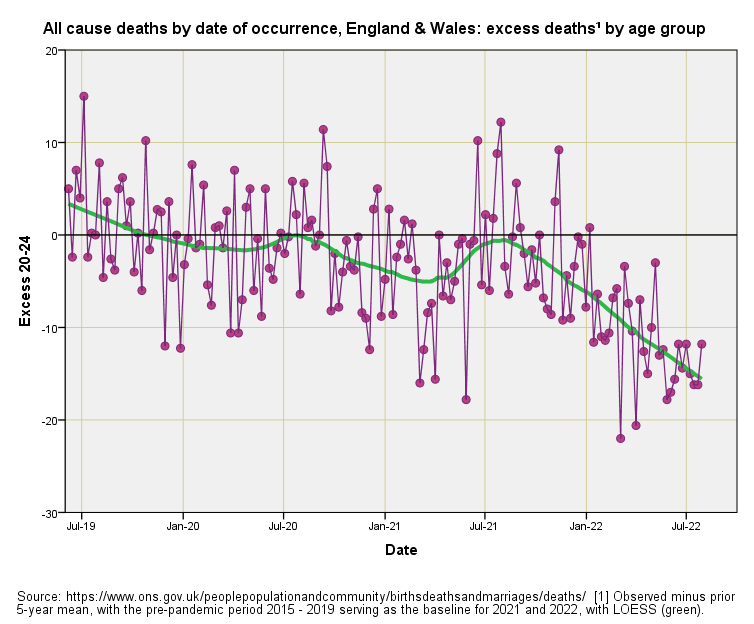
Kettle On!
Can anyone think of a way to determine the backlog of cases waiting autopsy and coroner's decision. My guess is that with a limiited number of forensic pathologists the backlog is building dramatically as demonstrated by the charts. Also the big boss would be happy for the longest delay.
Just found this: Nationally, there are 6 regional forensic pathology group practices supporting coroners and the police in England and Wales. Each group practice must consist of a minimum of 3 Home Office registered forensic pathologists.
So 18 minimum for all questionable deaths including those vaccinated at young age. Not found a way to investigate backlogs.