
Missing Deaths Exploration (part 1)
Weekly all cause death figures published by the Office for National Statistics do not stand up to scrutiny. The evidence indicates we are missing a bunch of young deaths.

Background
The Office for National Statistics (ONS) prefer to publish mortality data by date of registration (DOR) rather than date of death (DOD), this being a constant irritation to analysts chasing the harms and benefits of all that has transpired over the last 33 months. Whilst I touch upon the matter in several articles, this article series here succinctly captures the essence, revealing the ONS’ wooly reasoning as to why they do this crazy thing.
Since it is a legal requirement in the UK to register all deaths within five days then we may assume DOR and DOD counts are not going to get totally out of kilter over time and this was borne out by my analysis. The biggest headache that DOR data causes are spikes and dips in the record that are substantial during holiday periods when registry offices within each diocease are closed.
The Biggest Headache Of All
Spikes and dips within the DOR data record that arise from administrative matters are easy to iron out using various smoothing techniques. A preferable approach is to obtain counts by DOD but this must be done under FOI, and the ONS charge for their time. Any normal person would consider this to be unreasonable and ask why such data are not provided to the tax paying public free of charge and as a matter of course.
A bone fide dude who has been piling on the FOI and lashing cash is Joel Smalley of Dead Man Talking fame, who once again alerts us to gaping holes in the ONS data record in this splendid article. Scroll down his series of slides and you’ll see the death count for recent months evaporate as age declines.
There’s a good reason for this and that is deaths in young folk are supposed to be rare, such that when they do happen they tend to attract the attention of the coroner who has to rule out foul play, suicide and incidence of notifiable diseases. Thorough investigation of young death is vital for the future health of the nation and this process naturally incurs a time penalty. Hence Joel’s holes, which are a right old headache for anybody trying to quantify vaccine harm.
A Baseline Approach
After cogitating upon Joel’s FOI data, which may be found here, I decided to derive a baseline series for each age group based upon the standard ONS technique of prior 5-year means just to get me going. There are pros and cons to this method, which I beef on about in this article.
Joel’s data stretches back to 2014, which is a fair few years from 2022, and I bet that there are going to be bods who’ll point out that the population will have changed over this time frame, with each age band doing its own thing. To address this annoying wrinkle I pulled out my big table of annual mid-year population estimates by quinary age band and gender (source files for which may be found here) and used a modicum of linear interpolation to turn each year into constitutent weeks. This even bigger table enabled me to derive factors with which to finely adjust raw death tallies over the period 2014 - 2022, thereby effectively standardising counts with respect to 2020 subpopulations.
This is one of those utterly mundane data processes that is not unlike the tedious task of peeling chestnuts for the upcoming festive chestnut stuffing. Now that it is done I can bask in the knowledge of a good job done well, and maybe sip a dry sherry for good measure! For the curious I can reveal this made hardly any difference but at least we can point and grunt “age standardised!”
Observed Deaths vs. Baseline
In this first installment I am going to reproduce just four slides that give a flavour a what is going on. Hopefully these are self-explanatory, with the red line denoting observed weekly all cause deaths for each age group and the sea-green line denoting the prior 5-year mean on a week-by-week basis (baseline). Baselines for the pandemic years of 2021 and 2022 were derived from repeated 2015 -2019 pre-pandemic baselines; this being a technique that was adopted by the ONS, but which they subsequently dropped in order to ‘nudge’ figures (my exposure of this dirty trick is discussed here). Try these for size…
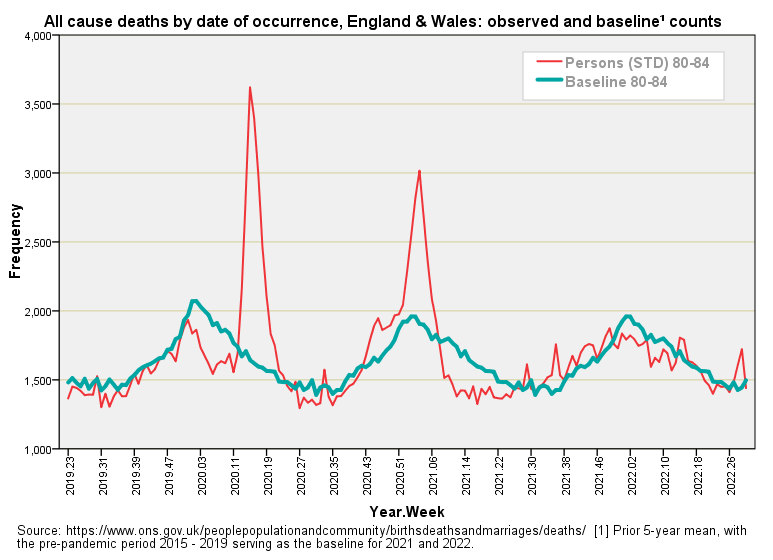
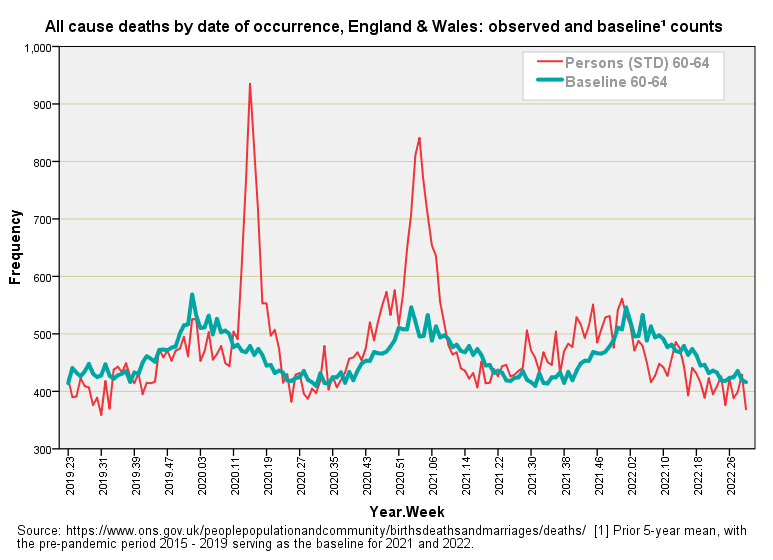
The older age groups delineate the pandemic that was, with two dirty great red spikes sticking up through the sea of green. We should note just how unremarkable the winter of 2021/22 was with regard to seasonal illness, with the observed counts tracking the baseline of expected counts pretty well.
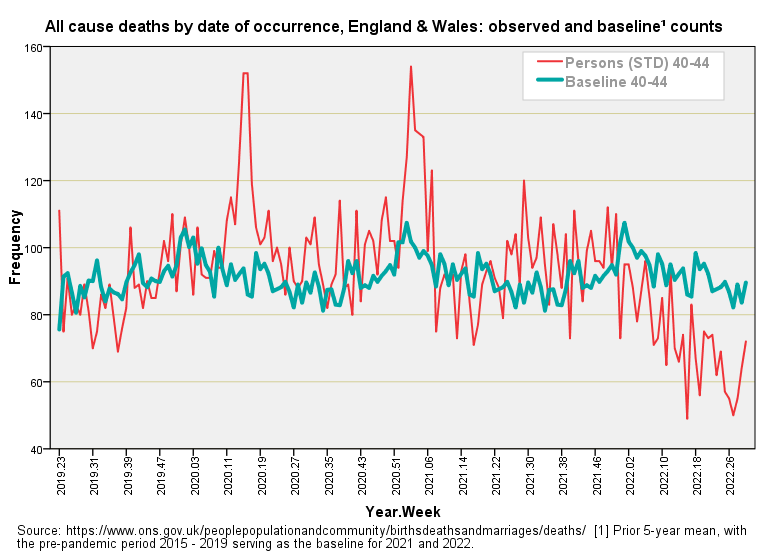
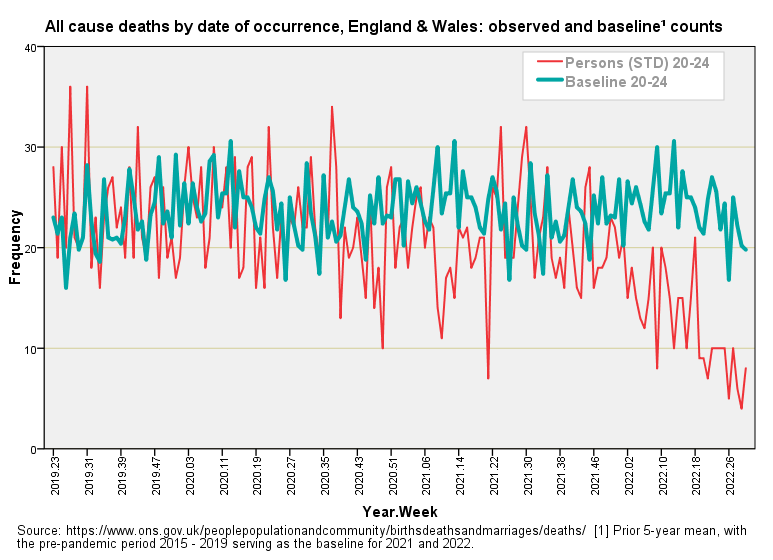
Once we get down to the 40 - 44y group we see a marked deviation between observed and expected counts from 2021/w51 onward. Given that the ONS updated these data on 23 November 2022 (week 47) then we may deduce processing delays of up to 49 weeks long (and perhaps longer). This is quite extraordinary.
Anecdotal evidence points to delays of several weeks and sometimes several months but we’re talking the best part of a year. Is this simply a function of delays incurred through post-mortem of younger cadavers or is something else more sinister going on? Is the ONS deliberately trying to paint a rosy picture of modest death in the experimental gene therapy era? We’ll probably never know and I’m not sure the ONS will ever know! Officers I’ve spoken to are very helpful indeed and advise caution against using death data less than 6 months old.
On The Stove…
On the stove is a series of slides revealing the difference between observed and expected death for all age groups so we can get a better feel for what is going on here. Whilst these lead to intial estimates for the volume of missing death, these must necessarily be underestimates of the true picture, for we can only judge matters with reference to a baseline. If the vaccines have been wreaking havoc as much as it would appear then we need to brace ourselves for an extraordinary degree of delay and/or cover-up. Until then…
Kettle On!
I've just been checking the age-adjusted mortality figures for Scotland, up to Q2, 2022
When compared with (say 1990 - 2007), overall death rates are still down: from about 1700 per 100k to 1350 per 100k.
But note that the second quarter of 2022 shows an unexplained rise in 'Other' heart disease.
The pre-covid years are showing around 400 all-ages deaths a quarter, but suddenly this jumps to 523 in Q2, 2022.
Note, there are also 6 deaths noted as Covid vaccines adverse effects, but all in Q2 , 2021.
There were 64 deaths in the 15-24 age group in Q2, mostly males (n=48) - most male deaths (n=26) appear to have been external causes: murders, accidents, poisoning etc.
Its a handy dataset: easy to interrogate: what do you think?
https://www.nrscotland.gov.uk/statistics-and-data/statistics/statistics-by-theme/vital-events/general-publications/births-deaths-and-other-vital-events-quarterly-figures/2nd-quarter-2022
Very interesting charts indeed!
I notice that people reading John's substack think the reason for the oddities is that the government is covering up something. From previous comments John has made about FOI requests to the ONS, I gather that they have been helpful to John.
The thing is that there could be all sorts of reason for the oddities in the data that have nothing to do with people trying to cover things up. Why can't it be as simple as this is a government bureaucracy and as such they are not very efficient? Or the left hand doesn't know what the right hand is doing? Or the systems are antiquated and it is not easy to organize the data? Or they never had to analyze data with this precision before and they are still scratching their heads on how to organize it, how to analyze it, etc?
It is crises like covid that clearly illustrate that government organizations are not nimble and effective at responding to changing circumstances.