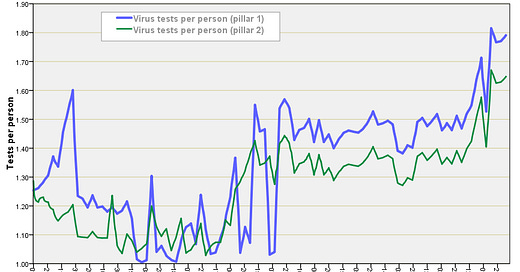
In my last newsletter I finished up with the promise…
I shall be taking a look at nose poking rates in my next newsletter. More noses means more cases!
Although Her Majesty’s Government publish some rather useful reports and figures for the test & trace programme, together with some rather useful figures for testing by pillar, anybody who has tried to reconcile the two datasets will have likely banged their head on the table. Let me illustrate.
More people tested than tests!
In the week beginning 27th January ‘22 (week 105 of the test & trace programme) we observe 807,307 people tested under pillar 11 of the national scheme and 4,368,158 people tested under pillar 22 according to the latest test & trace datafile. If we flip to the coronavirus dashboard data we find 516,054 viral tests undertaken under pillar 1 of the scheme and 7,197,674 viral tests undertaken under pillar 2 of the scheme for the same week.
Combining the two data sources we find 7,197,674 pillar 2 tests undertaken on 4,36…


