Prior Risk Of Death (part 3)
I attempt to derive a more sophisticated measure for how sick in-patients are in the first instance and find something rather unexpected
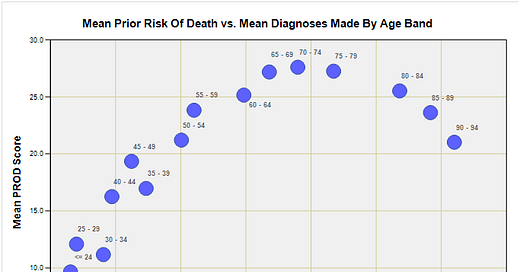
In part 2 of this series I ended the article by cogitating on how best to deal with tail-off in diagnostic enthusiasm in the elderly. I mulled over some form of adjustment but binned this approach for being too frothy. Instead, I reached for the bread knife and decided to slice the sample into a number of sections. Too many sections and statistical power would evaporate, too few sections and diagnostic bias would be inadequately dealt with. Encouraged by the increasing mean diagnostic count up to the age band 90 – 94y I decided to cut the loaf at this point, which cost me a total of 1,222 cases (6.3%). The relationship between prior risk of death (PROD) and the total number of diagnoses made now looks like this:


