Prior Risk Of Death (part 3)
I attempt to derive a more sophisticated measure for how sick in-patients are in the first instance and find something rather unexpected
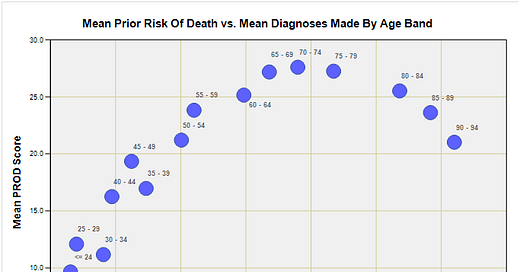
In part 2 of this series I ended the article by cogitating on how best to deal with tail-off in diagnostic enthusiasm in the elderly. I mulled over some form of adjustment but binned this approach for being too frothy. Instead, I reached for the bread knife and decided to slice the sample into a number of sections. Too many sections and statistical power would evaporate, too few sections and diagnostic bias would be inadequately dealt with.  Encouraged by the increasing mean diagnostic count up to the age band 90 – 94y I decided to cut the loaf at this point, which cost me a total of 1,222 cases (6.3%). The relationship between prior risk of death (PROD) and the total number of diagnoses made now looks like this:
Though, to split hairs, I should be labelling PROD as prior risk of diagnosis, this being a compound score transformed to a scale of 0 – 100 and deriving from diagnostic prevalence. We may therefore consider PROD to be a proxy for case commonality with the number of diagnoses made being a proxy for case complexity. Though clearly associated (r = 0.584, p<0.001, n=18,235) I consider these two variables to represent two different vectors in variance space (i.e. they’re saying slightly different things).
We can assess this idea by running a very simple model for the prediction of acute respiratory conditions in the 18 – 94y age group over the period 2020/w11 – 2021/w36:
Here we see PROD make it through the conditional selection procedure along with Diagnoses and their interaction term Diagnoses by PROD, these all being highly statistically significant terms (p<0.001). Both PROD and Diagnoses yield odds ratios (OR) greater than unity as we would expect, but their interaction yields an OR of just less than unity (OR = 0.99). This is what happens when two terms are not fully independent, though a value as high as 0.99 suggests a fair degree of independence since it is flinchingly close to unity.
BISCUITY NOTE: Independence is a statistical term that simply means two variables may vary independently of each other (e.g. the thermostat on my electric oven doesn’t affect the height of the flames on the gas hob above it). Independence thus allows for additive effects such that I can whack my oven up to max and my gas hob to max if I want to warm the kitchen quickly on a cold day. In terms of PROD and Diagnoses that interaction term works to regulate matters; that is, it serves to slightly dampen any additive effects. We may conclude that both PROD and Diagnoses will usefully contribute to model development.
PROD, Age & The Healthy Vaccinee
One analysis we can perform without further ado is to plot out the mean PROD score by age band according to probable vaccination status. Here is that plot:
Now this is mighty interesting! We may note zero vaccinated deaths in the 18 – 29 category, this being a function of the limited time frame for the data dump which ends 2021/w36, with rollout for those aged 18 and over commencing 2021/w24.
We observe a sizeable discrepancy in mean PROD scores for the younger age groups, with the unvaccinated cohort below 70 years of age yielding higher means. Thus, we discover that unvaccinated young folk were generally sicker prior to death than their vaccinated counterparts in the first instance. Parity is achieved at 70 – 79 years of age, beyond which we observe an inversion. This finding runs contrary to the widely accepted assumption that unvaccinated folk are healthier and thus less likely to die. The implications for assessment of vaccine harm/benefit are profound.
The keen reader will point out that this analysis includes COVID cases which are going to distort the picture, so here is the analysis again with 3,412 declared COVID cases excluded:
We observe a near identical picture. The ultra keen might at this point argue that PROD is not a sensible measure of health status, so let’s take a look at case complexity in terms of the number of diagnoses made for non-COVID cases:
There it is once again. There is no denying that unvaccinated folk up to the age of 70 – 79y were generally sicker than their vaccinated counterparts prior to admission and death. In stating such I have deliberately ignored the wild point for 30 – 39y owing to the extreme range of the standard error bars, indicating a trivial sample.
Needless to say this somewhat puts a damper and a half on claims of vaccine benefit – vaccinated folk were healthier in the first instance, at least in this sample! I have no doubt those in authority know this.
What I need to do now is go away and re-build the model developed for Do COVID Vaccines Work? (part 12) using PROD, my probable COVID indicator and my probable vaccinated indicator for the 18 – 94y group and see what falls out of the bottom in terms of vaccine harm/benefit assessed as honestly as I can muster.
Flapping About Again
Yes indeed, this is a lot of flapping about but the struggle here – and it’s a sizeable struggle - is trying to get real world retrospective observational data to be sufficiently free from bias as to give us a sensible evaluation of vaccine harm/benefit in terms of prevention of acute respiratory conditions over the pandemic period.
So many goalposts have shifted that I’m no longer sure we are even playing football but, of course, this doesn’t stop a number of experts with vested interests trying to pull a fast one by relying on these many biases and confounding factors to pretend that the COVID vaccines are safe and effective.
Summary
Prior risk of death (PROD) is a score derived from the frequency of 11 diagnostic groupings within the dataset. As applied to an individual it provides a proxy measure of how sick people were prior to admission, which in turn may be reflected in decision to vaccinate.
PROD, together with the total number of diagnoses made, can usefully characterise just how sick folk were at admission and prior to death.
Vaccinated folk at admission and prior to death were generally healthier than their unvaccinated counterparts in terms of prior risk of death (PROD) and total diagnoses made. Claims of vaccine benefit assume parity in general health across cohorts but this is erroneous.
Limiting the sample to 18 - 94 years of age at death limits the impact of diagnostic drop-off in the elderly.
Kettle On!
A recent booster study just getting even more ridiculous than before:
"This corresponds to a 94.8% lower mortality not related to Covid-19 among participants in the booster group and indicates a markedly lower incidence of adverse health outcomes in the booster group."
https://www.nejm.org/doi/full/10.1056/NEJMc2306683
I don't yet accept the finding of worse health in the unvaccinated in your above charts as I do not know the size of each age group. Does what is going on in those oldest age groups outweigh what is going on in the lower age groups ?
Good, thanks. I’ve heard this (injected cohort inclined to take better care of themselves) as the better explanation (vs. simply injection status) for why red states (with less biologic uptake) fared more poorly than blue states with regard to health outcomes from Covid.