Spectral Analysis Of Certified COVID Death (part 5)
I put down my engineer’s spectral spanner and provide evidence of a worsening situation with regard to acute symptomatic COVID.
Hors D'oeuvre
I am hoping that readers realise that when I use the phrase ‘COVID death’ this means absolutely nothing. By way of refresher it means that somebody was given an ICD10 coding of U07.1 (COVID-19, virus identified) or U07.2 (COVID-19, virus unidentified) prior to death by the Trust clinical coding team after browsing through the casenotes. What actually caused the death of the in-patient is another matter, and given the widespread abuse of the PCR test we can’t even be sure that a positive test result meant the deceased had traces of fragmented SARS-COV-2 virus let alone intact active virus. Neither can we entirely trust any clinical diagnosis made if ad hoc whistleblowing is anything to go by. Just how shaky assignment of causality in the complex endpoint of death can be is made abundantly clear in several previous articles. The phrase COVID death is thus a literary convenience more than anything.
Gazpacho
In part 4 of this series another couple of those mighty strange results popped out of the non-official oven of a former ‘official’ using official data. We discovered that the proportion of symptomatic COVID in-hospital death to all COVID death was lurking down at a mean of 0.54 (54%) for the first wave period of 2020/w6 – 2020/w34 for a sample of 1,007 adult in-hospital COVID deaths, this being affectionately known as the 2020 spring death spike, being a period of inexplicable catastrophic health collapse. If symptomatic COVID (not necessarily a fatal condition) was down at 54% of all COVID deaths on average then what caused that great and sudden hike in hospital deaths back in spring 2020?
If vaccines are meant to reduce severity of symptom and prevent hospitalisation we should be able to see clear evidence of this in terms of lowered incidence of symptomatic COVID cases following rollout. The second of those mighty strange results revealed a surprisingly high mean proportion of symptomatic COVID death in the post-vaccine period (0.69) compared to first wave period (0.54) and second/third wave periods (0.67). In a nutshell – and given the usual caveats - we may conclude that the vaccines have done absolutely nothing to reduce the incidence of symptomatic COVID.
Qu'est-ce que c'est que ça?
Some readers may question what I mean by ‘symptomatic COVID’; a fabulous question that deserves a refresher. Whenever I use the phrase symptomatic COVID I am referring to records of adult in-hospital deaths with an ICD10 emergency code of U07.1 (COVID-19, virus identified) or U07.2 (COVID-19, virus unidentified) that also possess a respiratory diagnosis in the range J00 – J99; that is to say any and all respiratory conditions count toward a ‘symptomatic’ death even if the common cold (a.k.a. J00 – Acute nasopharyngitis [common cold] ). In doing this I am deliberately throwing the symptomatic COVID net as wide as possible, even if I’m in danger of dredging up tiddlers. You could call it bending over backward, I guess, though I've never figured that peculiar idiom.
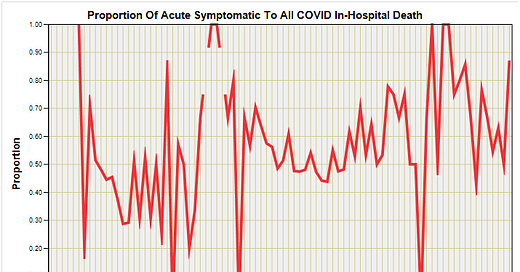
Some may gasp at this rather loose approach so I’m going to remedy the situation here and now by flagging up what I shall call acute symptomatic COVID death. ‘Acute symptomatic’ refers to all those in-patients suffering a potentially fatal respiratory condition such as pneumonia, respiratory arrest, respiratory failure, and ARDS (acute respiratory distress syndrome). In short these are positive-testing in-patients in a very bad way prior to death, being the sort of case that was portrayed in NHS advertising campaigns that had little to do with clinical reality save for a small number of cases who were already rather ill in the first instance.
But enough griping! Let us take a look at the proportion of these rather severe cases amongst all COVID cases as it unfolded over time – let’s have a look at RealCOVID™:


