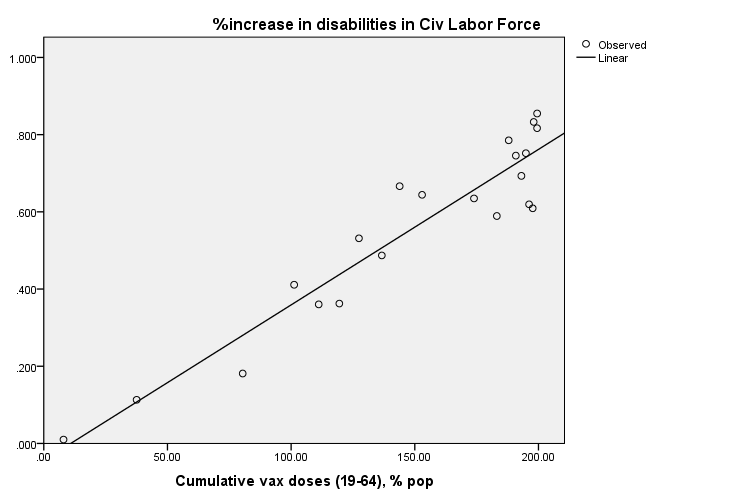
US Civil Labor Force Disability & Accumulated Vaccine Doses: A Case Of Bent Regression?
A statistical side note for the Phinance Technologies humanities project for all those who like to debate the number of angels dancing on the head of a pin.
Now and then a Tweet catches my eye, and these two from the formidable Jonathan Engler of HART did just that:
The link to source may be found here.
I know this is a drop of the ‘good stuff’ because I asked Mrs Dee to look over my should at the screen and she gasped. She’s not a numbers person by any means but she instantly recognised a correlation when she saw one.
Having a cuppa already to hand I followed the Twitter thread in earnest and stumbled over this tree stump:
Now that is fair criticism indeed and a topic I covered way back on 5 July 2022 in an articled entitled Baking Better With Cochrane-Orcutt (part 1). Serial killers kill people and serial correlation kills analysis. You’ll need to read my series or digest some indigestible Wiki to grasp why but it all comes down to the assumption of independence of measure, being a ‘law’ that sits at the heart of a great deal of statistics.
The Law Of Jam Tarts
Accumulated anything, by definition, cannot meet the requirement of independence of measure since today’s figures will be dependent on yesterday’s figures and yesterday’s figures will be dependent on the day before that, and so on. For example, my accumulated jam tart total for Friday cannot possibly be lower than the value on Thursday. It can equal Thursday’s accumulated tally if I refuse to scoff any on Friday but that’s it. This presents a problem when we come to do an analysis that assumes Friday’s tally can be lower than Thursday’s. If we ignore this law of tarts we start seeing correlations when there aren’t any.
A Fig Roll Of The Imagination?
The question immediately leaps up as the whether Phinance Technologies have baked a blooper. Having dealt with problems like this for +30 years I smelled a decent result beneath those dancing angels and penned a rare Tweet:
OLSR *can* be performed but correlation will be inflated owing to lack of independence of measure. A simple matter to flip to autoregression techniques such as Cochrane-Orcutt, Prais-Winsten or Maximum Likelihood methods but these are not going to change the main finding.
Not content with nosing alone I whipped out my stats package and ran the towels over the data to confirm matters in a rigorous fashion.
Results
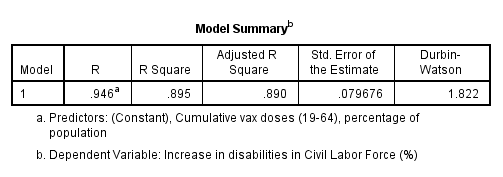
Here’s my replication of Phinance Technologies ordinary least squares linear regression (OLSR) in boring grey and black:
There’s the R-square precisely at R² = 0.895 as before but note the coefficient for the intercept has shifted by a factor of 100 from -0.0004 to -0.0439; this comes about if you regress the figures as proportions rather than percentages - a small matter.
A bigger matter is the finding that the intercept (constant) fails to reach statistical significance, with a probability value of p=0.394:
If we are being perfectly parsimonious about this we can this drop the insignificant intercept (constant) and stick with just a rate. This is a good thing because not only will it improve model fit but it also comes with genuine real world meaning; that is, zero dosing is associated with zero increase in disability. Now that is what I call sensible!
Yes, But What About The Tarts?
OK, so we’ve confirmed some things and tidied up some things but the BIG question is whether the entire analysis ought to be dismissed on über-nerd grounds. The answer is NOT ON YOUR NELLY and the beady-eyed will already have spotted the evidence supporting this shouting. In the bottom table is a value of 1.822 under a column headed Durbin-Watson, this being the acid test for serial correlation. A quick look in a stats reference book that cost more than my first car reveals 1.822 is well past the upper limit of du = 1.42 set by Durbin and Watson themselves, indicating that there is very little serial correlation floating around to throw the analysis off track.
To prove this I wielded a spanner called autoregression and dialled in the Prais-Winsten method. The final iteration of this procedure settled on a value of ρ = 0.089, that odd little ‘p’ being the Greek letter rho, and the symbol representing serial correlation. Given that 100% perfect serial correlation would yield ρ = 1.000 then we can see just how weak that effect is.
It should come as no surprise, therefore, to learn that autoregression using Prais-Winsten yielded a near identical result to PT’s original. Herewith the telling table:
Right under the letter ‘B’ is the very same rate value of 0.004 that was announced in PT’s original slide. Well done bods at PT, good one!
Conclusion
Arguing over the number of angels dancing on the head of a pin is where the unthinking (unfeeling?) pro-vax brigade are tending to take arguments on social media these days, when all we have to do is count bodies amongst friends, family and colleagues.
Kettle On!


Thanks very much.
Not sure if you saw, but the authors made this very reasonable point back to me:
As the adverse effects occur over a wide and variable period after dosing, a cumulative series is more informative.
https://twitter.com/jengleruk/status/1614033878506930176?s=20&t=SUs8awZM-Te8M1lcihz2Zg
Is there an equivalent data series in the UK? I keep hearing that the over 50s have left the labour force post lockdown and aren’t coming back. Allison Pearson at the DT thinks it’s because of work wokery but I smell something more sinister.
https://www.telegraph.co.uk/columnists/2023/01/11/over-50s-driven-work-wokery/