
Using ARIMA To Investigate Reinfection
Assessing the influence of mass viral testing programmes on case positivity: are we experiencing a testdemic?

In Case Count Heads Up I drew attention to the fact that daily COVID case counts now include first episodes as well as reinfections so the political situation is never going to ease since they can spin this out year in, year out. On top of that, in Baking Even Better with ARIMA (part 3), I presented the results of statistical modelling that provided strong evidence for both a testdemic and a vaxdemic to the tune of 66.1%; that is to say, an estimated 66.1% of new first episodes are being generated by the test regime itself, with an estimated 2.7% of cases arising directly from vaccination.
The situation can be likened to an Ouroboros in which the viral test and the viral panacea generate the situation that demands a viral test and viral panacea. With each serpent cycle human rights are diminished on a global scale and those with vested interests in maintaining the illusion get richer, which is why I coined the phrase Ourobuggered back in 2021.
This morning I am going to repeat my ARIMA modelling process but flip to predicting daily counts for reinfections instead of new episodes. Let us then take a look at what we’re trying to model…
Daily New Reinfections
According to the UK GOV coronavirus dashboard these came into existence on 19 Jun 2020 so I have plotted the time series from the first of that month to keep things nice and tidy:
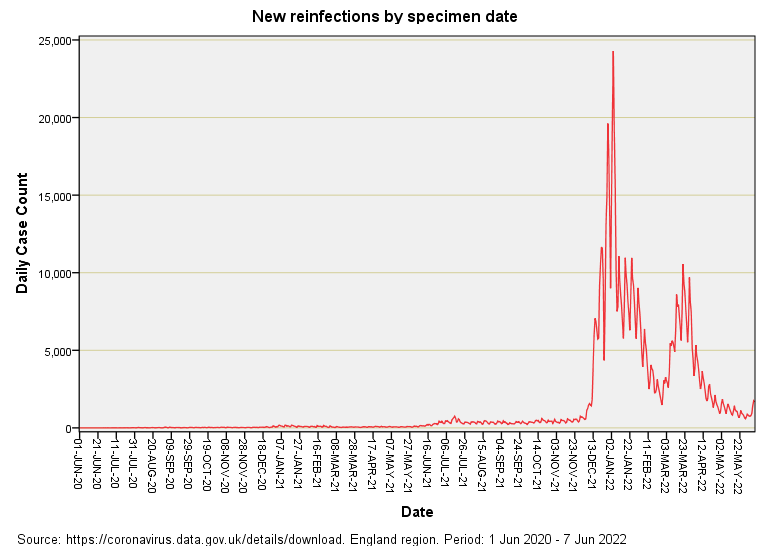
Ain’t that curious? There’s hardly any sign of a surge during the first winter season of 2020/21, then a peculiar ramp from Jun 2021 onward until the series goes berserk during the winter of 2021/22. Not content with one episode of winter berserk the series gets angry again in a rather unseasonable manner during spring of 2022. Two rather unpleasant mutations perhaps… or something else entirely?
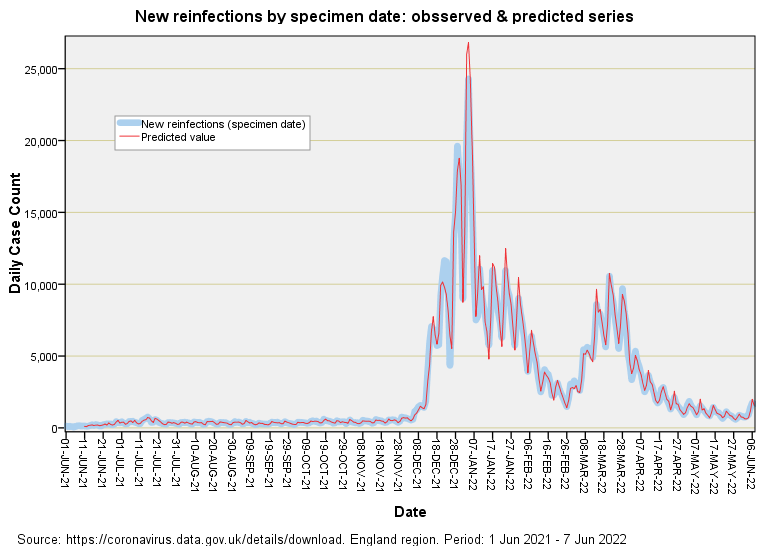
A lot of nothing happening doesn’t make for good modelling so I decided to shorten the series to Jun 2021 - Jun 2022 to see what would pop out from the ramp onward, this giving us a run of 372 data points.
ARIMA Results
Well here they are, still warm from the oven for an ARIMA (0,1,0)(0,1,1)-7 structure…
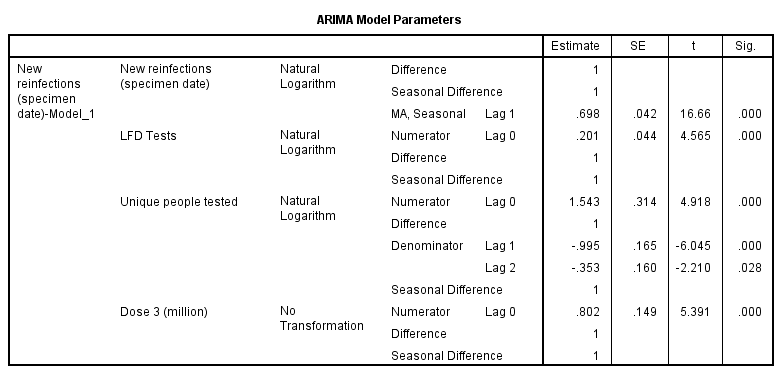
Once again we find LFD test activity, unique people tested and administration of the third injection/first booster the key ingredients in the prediction of daily new reinfections. One feature of this model that is well worth noting is the total lack of non-seasonal and seasonal1 autoregressive (AR) components (i.e. p=0, P=0) which means there is no ‘memory’ effect within the differenced time series for new reinfections. A memory effect is what we’d expect if a genuine virus was doing the rounds but all we have here is a time series that consists of a series of random shocks. The only structure that we see arises within the independent variables. In plain English, this ain’t no mutated virus spreading over time and infecting folk, it’s a test and booster lottery!
So what of that all important coefficient of determination (a.k.a. R-square) that provides a measure of the strength of the relationship between independent and dependent variables?
I can report that this model structure yielded R-square = 0.321, which means that variation in test activity, together with the first booster accounts for 32.1% of the variation we see in new reinfections for the study period of 1 Jun 2021 - 7 Jun 2022. The lowish value for R-square likely arises through the random nature of the situation.
The Pudding
In summary, and upon tasting the pudding, I shall declare this as further evidence of a test ‘n’ vaxdemic where just under one third of reinfections being detected are being generated by the test and vaccine regime itself.
Kettle On!
The ‘season’ in this instance is the 7-day week.