Vaccines & Death (part 1)
Red pill confirmation of the alarming findings of Steve Kirsch
The Red Pill
Underneath a no-punches-pulled title of ‘Vaccines are taking an average of 5 months to kill people’, subtitled: ‘The CDC has been hiding the Social Security Administration death master file. I got it from a whistleblower. This shows deaths are taking 5 months from the jab to happen. This is why it's hard to see.’, Steve Kirsch sets out an analysis that sure got me reaching for my stats package early this morning. When I say ‘early’ I mean 4:45am. You can read his free-to-view bombshell article here.
If Steve has hit the nail on the head for the US then it should be possible to confirm his findings using UK data, so I grabbed Deaths registered weekly in England and Wales, provisional from the Office for National Statistics (ONS) and daily dose data for England and for Wales from the UK GOV coronavirus dashboard. The latter required a weeny bit of addition within my spreadsheet to arrive at the grand weekly total for first, second and third jabs for England and Wales combined.
It’s important to note here that the UK GOV vaccination figures are by date of publication and not by date of jab since date of jab is only available for the nation of England. Yes, it sucks. The second thing to note is that I’ve gone for all three jabs, whereas Steve’s analysis was based on first and second jabs. If serious sh*t is happening this won’t matter too much and we’ll confirm his findings regardless.
The Scene With No Lagged Effects
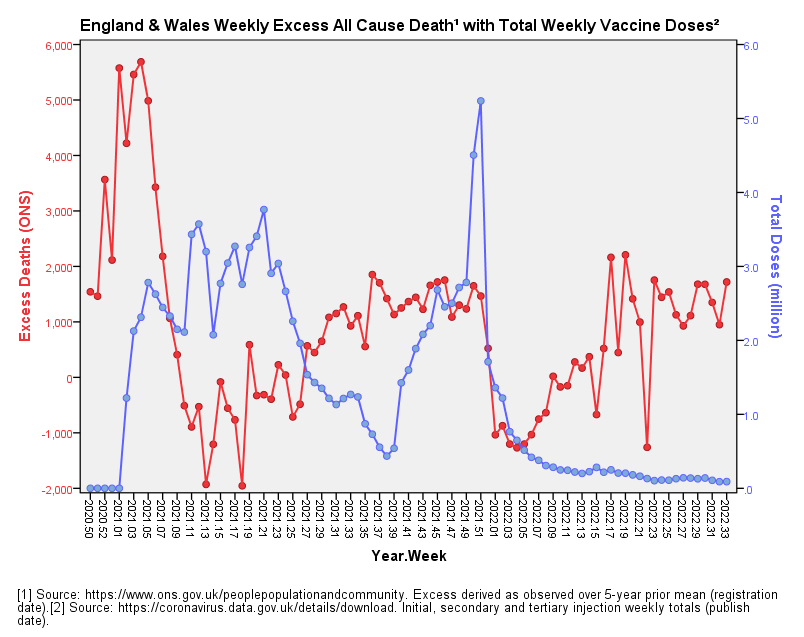
I always like to survey the scene with nothing fancy going on, so here’s a dual time series plot of excess all cause deaths with total weekly doses. There are a number of ways we can go about calculating excess deaths and I’ve talked about the pros and cons of these in previous newsletters (try this one for size). Joel Smalley over at Dead Man Talking also covers these issues well in certain of his excellent articles. For the time being I’ve stuck with the simple but dubious method of subtracting the prior 5-year mean baseline from observed weekly counts primarily because this is what the ONS do and I wanted to juggle variables that officialdom will like the smell of.
One stupendous wrinkle with this method is how we go about calculating a sensible excess for 2021 and 2022 given a pandemic of some sort was raging in 2020. The ONS side-step this by repeatedly using 2015-19 as as prior 5-year baseline period, which causes me to flare my nostrils. With nostrils suitably flared and my brow furrowed I swallowed my disapproval and followed suit to ensure an appealing bouquet with a whiff of Whitty. Here’s the result:
The 2020/21 winter peak is hard to miss, with excess death peaking at just under +6,000 deaths per week. Obviously we can’t put this into historic context, so until we do I suggest we tone down the hysteria. Moving along the bus we have a blue hump of mass vaccination that seems to have its echo in excess death 20 - 28 weeks down the line. We then get to see a dip in excess death around 20 - 24 weeks after a dip in the weekly dosing of the nations of England & Wales, this being followed by a rise in excess death after a rise in booster dosing.
The Scene With Lagged Effects
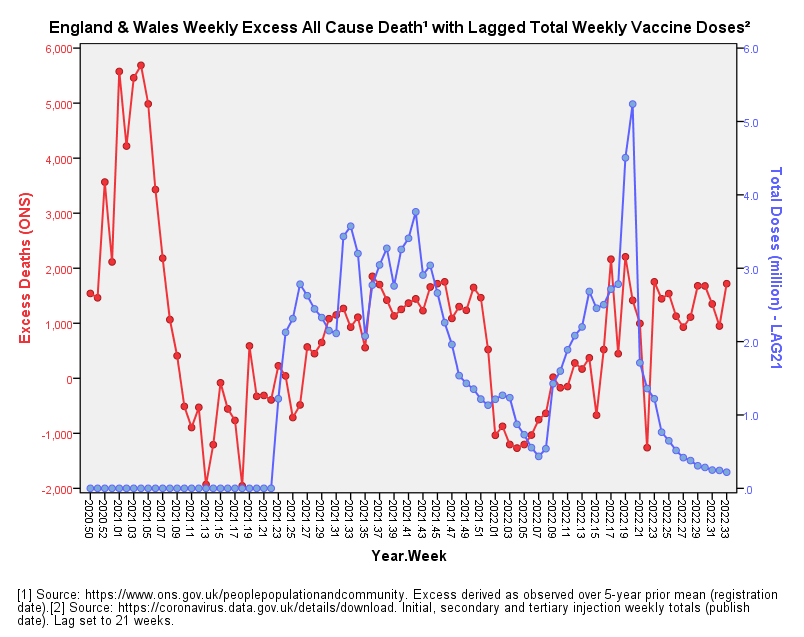
That sure raised both eyebrows so I decided to slide the dose data series along by 21 weeks in keeping with Steve’s findings. This is what that graph now looks like:
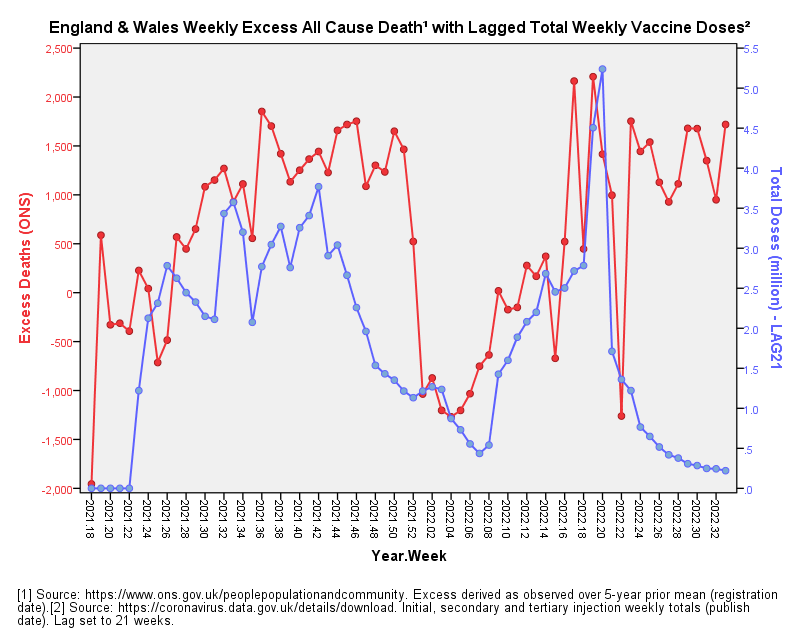
I don’t know about you but this isn’t something I’m enjoying looking at. My eyeballs are telling me this is too close for comfort. Here’s what these two series look like if I zoom in and re-scale both axes:
If people aren’t swallowing hard at this point then they’re not really getting to grips with what we’re seeing. What we’re seeing is a correlation that is extending over time, and a half decent correlation at that (r = 0.366, p<0.002, n=86). Some folk will invariably point out the lack of correlation over recent weeks as though it were some sort of get out of jail card. In return I shall point out that I’ve not included dose 4 and dose 5 figures since UK GOV dashboard crew haven’t released this data as yet.
The Big Spanner
What we need here is to pull the big spanner out of the bag, this being ARIMA time series modelling, and run an intervention-style analysis; that is to say, a statistical analysis that formally determines if combined weekly vaccine doses have got anything to do with weekly excess all cause death over this time frame.
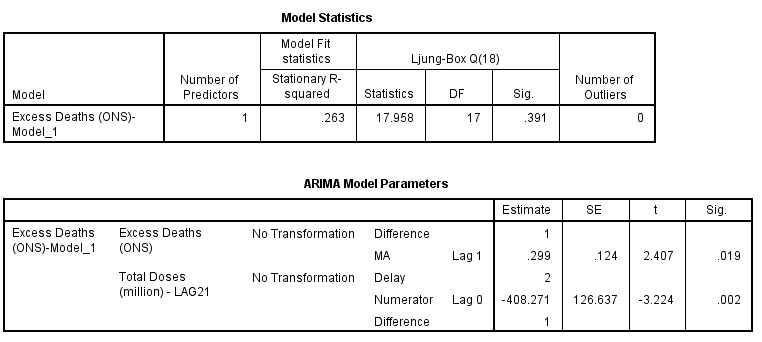
To invert a phrase from the truly excellent Little Britain, “computer says yes”, for an ARIMA(0,1,1) model furnished a p-value of p=0.002 for the independent variable labelled Total Doses (million) - LAG21. And here is the very result as it appears on my workstation:
Experienced analysts will note the delay parameter of 2 weeks for the independent variable of interest, thus a lag of 21 weeks is a good starting point but ARIMA wants to shift it to 23 weeks. Five months it is, then.
Experienced analysts will also want to get a handle on the coefficient of determination; this fetches-up at r-square = 0.254. In plain English this means 25.4% of the variation we see in weekly excess all cause death over this period can be explained by variation in weekly combined dosing alone. In terms of predicting something as variable as weekly all cause death across two nations over a period of 68 weeks this is nothing short of astonishing.
This all sounds cracking but there is a monster sting in the tail, this being the negative coefficient of -408.271 for delayed vaccine doses. In short this is a model for delayed vaccine benefit. A shocker indeed, and I shall be looking deeper into this as we go along.
The Pudding
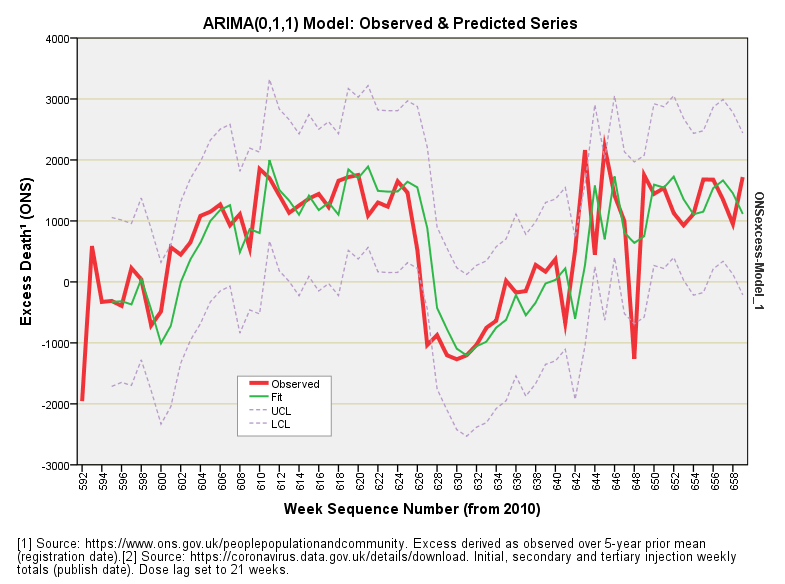
I always enjoy a decent pudding, so here is the ARIMA model with lagged vaccine dosing doing its thing in attempting to track the variation in excess death:
That’s not half-bad, even if I say so myself!
After coffee and cogitation I’ll see how this work can be refined, developed, enhanced, validated, cross-checked etc etc. Until then…
Kettle On!


Just about to grab some breakfast and then I'll have a look at non-COVID death to rule out delta etc variants.
I have hardly ever commented on your articles but wanted you to know that I read every single one.
Brilliant work.