
Vaccines & Death (part 3)
Further investigation into delayed death following vaccination

In part 1 of this series I seemingly confirmed the somewhat disturbing results of recent research undertaken by Steve Kirsch over in the US using data supplied by the UK GOV coronavirus dashboard and the Office for National Statistics (ONS). ARIMA time series modelling formally confirmed what our eyeballs were telling us, this being the inescapable fact that weekly excess all cause death in England & Wales was following the pattern of weekly vaccination dosing (any and all doses) with a delay of around 5 months. I say seemingly because I ended-up with a model that indicated vaccine benefit and not harm.
All cause death necessarily includes COVID cases and so I derived a time series for weekly excess non-COVID death to determine whether delta and other variants might be driving results. The results were presented in part 2.
Given that death certification isn’t as robust as we’d like to think (a confidential chat with an honest GP is highly recommended for those who dream that it is) it occurred to me that some non-COVID deaths may well have been misclassified (e.g. false negative test results), so we ought to cross-check results by running the same analysis, not with vaccine dosing, but with disease prevalence (proportion infected within the population). We may think of this as developing a baseline model against which our hypothesis may be tested. In this newsletter I shall be revealing the first tranche of this additional work.
Case Detection Rate
Disease prevalence is usually expressed as the percentage of infected persons to all persons within a population such that 1% prevalence means 1 in 100 people are infected. If we undertake 100 viral tests on a random sample of people we are thus likely to detect just 1 infected person. However, if we undertaken 100,000 viral tests on a random sample of people we are likely to detect around 1,000 infected people. The infection rate has remained the same (1% prevalence) but owing to the larger number of tests undertaken we have ended-up detecting more cases.
I am sure all this sounds trivial to subscribers but the fallacy of comparing 1 case with 1,000 and claiming an increase in the disease without adjusting for test activity is exactly what authorities have gone and done since the pandemic began. I presume this to be a deliberate act of misinformation.
What I’ve gone and done to develop a proxy measure of disease prevalence that is reasonably free from sampling bias is to sum the daily cases for England & Wales (specimen date basis), then sum the total viral tests undertaken (PCR & LFD), thence to divide cases by tests to arrive at COVID cases per 100 viral tests.
Spiky Stuff
Daily data is a mighty spiky affair due to weekends and, owing to delays in administration in one set of figures or another, we can see some well-wacko percentage swings. Whilst this can be avoided by using some sort of fancy smoothing function it can also be avoided simply by calculating a rolling 7-day total for both cases and tests and using this to derive less wacko percentages. We may call this Rolling 7-day COVID cases per 100 viral tests but that really is a serious mouthful! Before we get stuck in further let’s just have a quick squizz at this series:

There we are! The monster spike that kicks off the pandemic is misleading in that the first few cases detected were folk already ill in hospital, with few tests being undertaken across both nations back then. In essence, we are looking at the state of play in just a couple of hospitals. As the pillar 1 and pillar 2 testing schemes rolled out across the country as a whole we start to see less biased estimates of disease prevalence. Since this is not strictly a measure of disease prevalence I’m calling it the case detection rate (CDR).
When I look at this slide I always ponder over the strange ramp in CDR from week 29 of 2021 onward. I also tend to ponder on the ‘triple humper’ from week 50 of 2021 onward. What we have here is the Loch Ness Monster! Are these humps the impact of variants spreading within the population in a transient manner or something else entirely? Let’s go see…
From Infection To Death
One last thing we ought to nail is the general delay from initial detection of a case to the death of that case for the time period under study. At the level of the individual this will range from the same day to several weeks, but at the level of the population the delay can be guesstimated by comparing the time series for excess all cause deaths with the time series for the case detection rate. Here’s one I baked earlier:
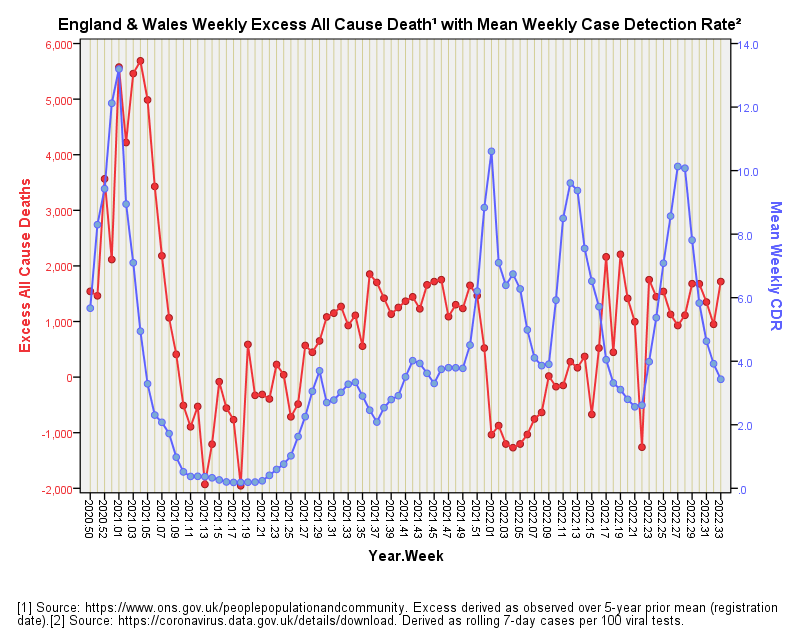
That dirty great spike back in the seasonal peak of 2020/21 is a mighty useful pointer to the general delay we may expect at the population level, this being 3 weeks or thereabouts.
Before we pass over this slide we ought to note something peculiar going on from the beginning of 2022. Up to this point CDR and death have gone along hand-in-hand in a most consistent manner, but at the very beginning of 2022 they markedly diverge with cases rocketing and excess deaths plummeting. Is this the outbreak of a mild variant, or perhaps vaccines conferring benefit, or perhaps a surge in herd immunity or something else? If it was a combination of a milder variant and vaccine benefit, for example, how could we then work out which was contributing what? The answer is we can’t, but that doesn’t stop the authorities claiming everything positive can only be vaccine benefit and nothing but vaccine benefit!
If it was vaccine benefit then it didn’t last long. So, did we experience three isolated bursts of transient benefit all in a row? I doubt it because we’d then have to ask why excess all cause death and CDR were increasing over time as the second dose roll-out got firmly underway back in mid-2021. That’s a bit awkward that is! One thing that is consistent about this slide is that it reveals inconsistency in the arguments made by experts.
Excess non-COVID death
With our 3 week delay in our back pocket we now need to swing around to looking at excess non-COVID death over the same time period. For this next slide I have taken the liberty of lagging the series for CDR by 3 weeks:
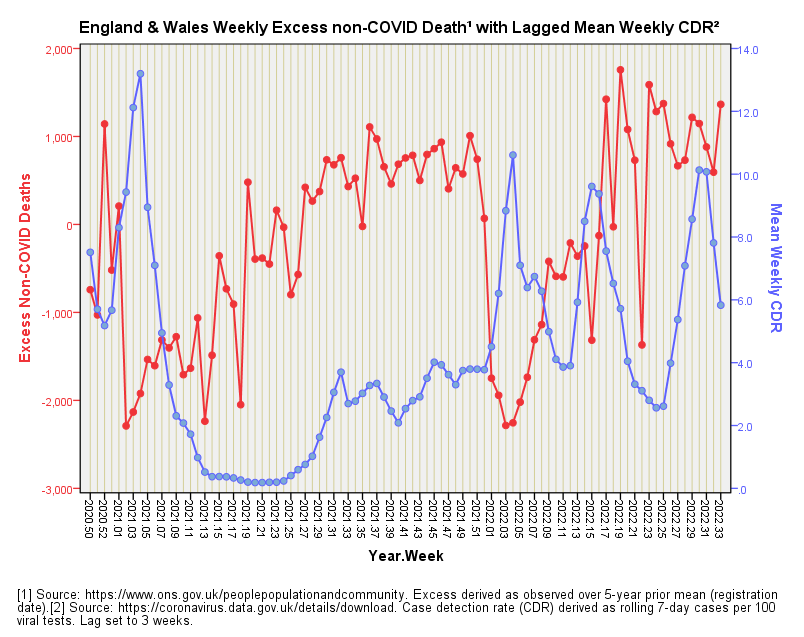
We start with a spike in excess non-COVID death that precedes the spike in CDR. Nothing causal there, methinks! Next up we have a mysterious ramp in excess non-COVID death that coincides with a period of nothing happening on the infection front. That ramp cannot be COVID, so what’s causing it? The vaccines, perhaps? Something else? It is only when we see COVID infection rates ramp up from 2021/w31 that we appear to be looking at a relationship or sorts but I’m guessing this is mere artefact. Indeed so, for we hit a massive inversion around 2022/w3 that blows that notion out of the water.
In general we don’t seem to have two well-correlated time series, which would support the assumption that non-COVID death means exactly that! For those who like these things the overall Pearson bivariate correlation between both time series popped-out at r = -0.179, p=0.093, n=89, so there’s not a lot of groovy stuff going on.
How Does The Vaccine Compare?
By way of refresher here is the slide for excess non-COVID deaths and lagged vaccine combined doses again. I’ve set the lag to 18 weeks rather than 21 weeks because I’m being cheeky:
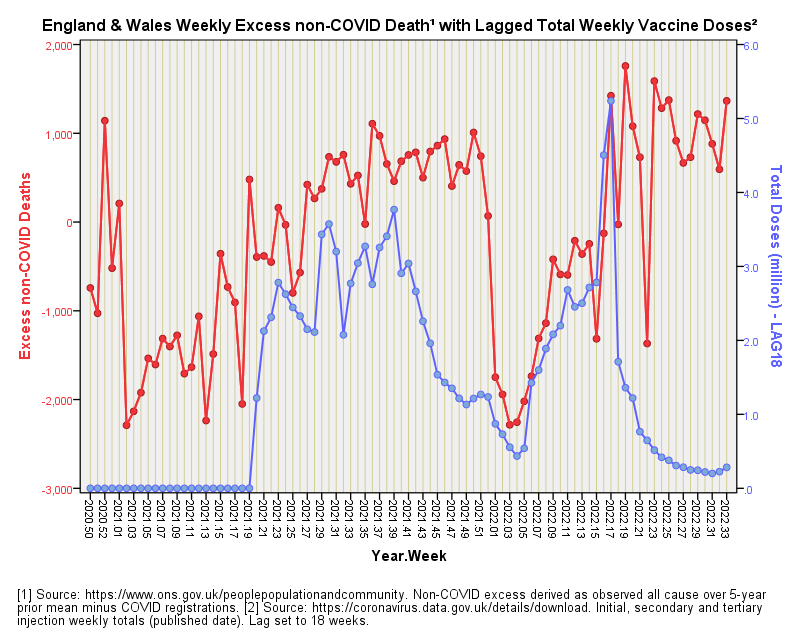
This slide sure looks more convincing than the equivalent slide for CDR! For those who still like these things the overall Pearson bivariate correlation between both time series popped-out at r = 0.356, p=0.001, n=89, so there’s something well groovy going on!
If you hid the Pearson results and hid the titles and axis labels and asked somebody to choose a slide that might just be revealing a causal mechanism by virtue of the closest correlation, which one would they pick? Which one would you pick? I’d pick the vaccine jobby but wonder whether the CDR jobby had anything at all to add. This is where we need to leave our eyeballs alone and reach for that big spanner again.
The Big Spanner
What we need is to turn once again to the formality of ARIMA time series modelling, and run an intervention-style analysis that determines whether the case detection rate has got anything to say for itself in the prediction of excess non-COVID death, and if so, whether this leaves any room for combined vaccine dosing to have a shout. At the same time we ought to stop fixing those lags at 3, 18 and 21 weeks using our eyeballs and start using some sort of objective process. Get some strong coffee on and get the biscuit tin open because I’ll be revealing more in part 4.
Kettle On!
I found the "5 month lag" in data late last year, but called it a "seasonal" effect.
How you checked with data in nations with delayed vaccination of their working age population to see if their lag is still 5 months, or if it's 3.5 or something that frames the health burden with the extreme seasonal months (Summer for the first round of jabs)? When I looked at data, summer jumped out at me more than did an exact clock.
Absolutely Rob. When I was the suit writing the big cheques for national surveys I only considered bids with significant prelim work and an interim report - that's where the contract breaker was put just in case the whole thing fell apart. Omnishambles is a perfect description!