

What bed is that, then? (part 2)
What bed is that, then? (part 2)
Entering the world of the bed manager...

In episode #1 of this series we learned some lingo and I produced a couple of interesting slides that revealed any bed, any time, any place, anywhere with anybody in it for any reason has been counted by NHS number crunchers, presumably in an attempt to bump positive test numbers to support draconian government policies. In this episode we are going to look at bed availability and occupancy with another splash of that numerical hindsight…
Bed availability
Let’s get that kettle on and get straight in…
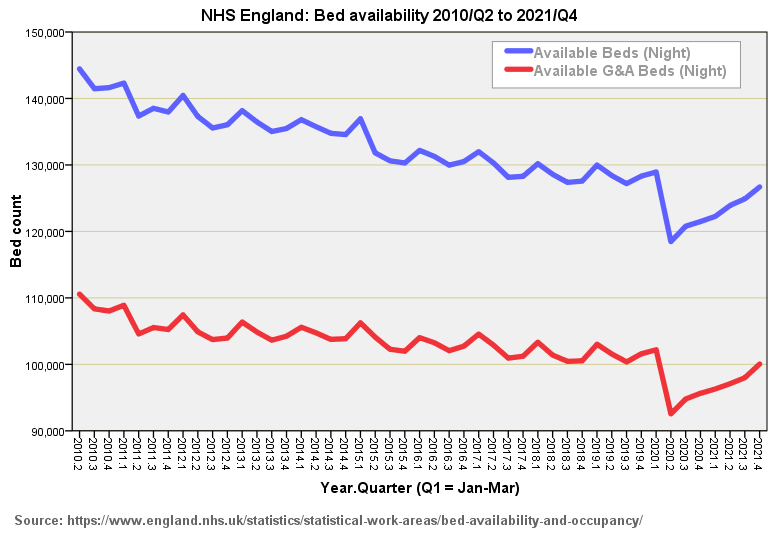
Here we have official quarterly figures for 2010/Q2 to 2021/Q41 right from the horse’s mouth. The blue series represents overnight beds for all allocations combined, and thus include general & acute, learning disabilities, maternity, and mental illness. I’ve split out the general and acute (G&A) series because these beds are what normal folk typically encounter when they take in a bunch of grapes and some flowers.
What should strike us here is that these precious beds have been in steady decli…
Keep reading with a 7-day free trial
Subscribe to John Dee's Almanac to keep reading this post and get 7 days of free access to the full post archives.