

What bed is that, then? (part 3)
What bed is that, then? (part 3)
Entering the world of the bed manager...

In part 2 of this series I ended with this paragraph:
‘With overnight bed availability around 8% down and occupancy around 20% down just how busy can our hospitals have been given the combined loss in throughput amounts to around 26%? Well, for the staff working in these hospitals life could have been totally and utterly hectic despite patient throughput being suppressed because we haven’t yet considered staff absences due to symptomatic COVID and staff absences due to a positive test. For the next episode I hope to collar a wedge of staff absence data…’
This morning I can happily report that I have indeed ‘collared a wedge of staff absence data’, which may be found sitting right at the end of the monthly COVID publication near the top of this webpage. The current XLSX file extends to 2 Feb 2022 and looks like this…
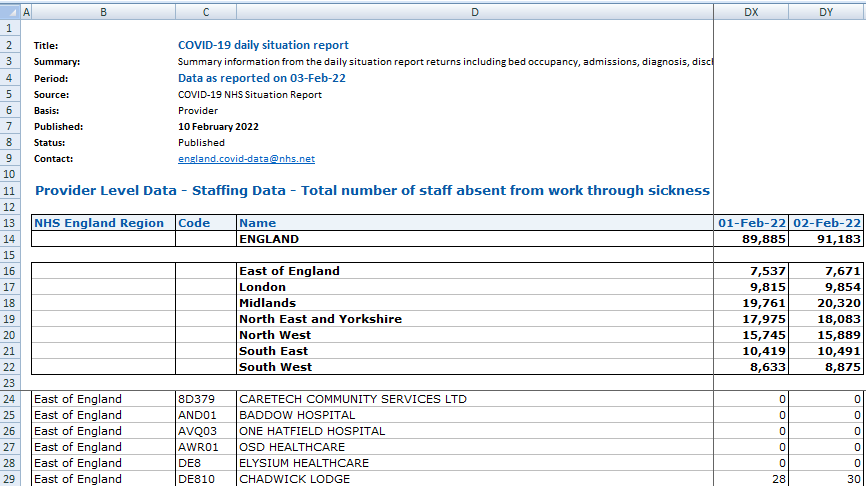
Cell B11 states: Provider Level Data - Staffing Data - Total number of staff absent from work through sickness or self isolation; so what we are looking at is staff absence t…
Keep reading with a 7-day free trial
Subscribe to John Dee's Almanac to keep reading this post and get 7 days of free access to the full post archives.