


Exploring Excess Death (part 3)
I investigate alternative methods for estimating excess death using ONS weekly registration data from 2010 - 2023

Right at the end of part 2 I suggested there is a better way to derive baselines. The ONS themselves are already on to this and had the cheek to publish this report whilst I was slap bang in the middle of typing up my investigations! If you’ll excuse me I’ll ignore these new-fangled developments and continue typing what I intended to type, and I shall start with the notion of exorcism…
Exorcising The Pandemic
What I am going to do here is reach for that all-time favourite spanner of mine for time series work: Autoregressive Integrated Moving Average (ARIMA). I am going to use the period 2010/w1 through to 2023/w52 and I am going to look at weekly all cause deaths in England & Wales. I am also going to switch on outlier detection in all guns blazing mode. Believe it or not there are no less than 7 outlier types defined within the ARIMA module of my stats package, and here they all are:

The idea here is to see what an ARIMA model throws up by way of outlying weekly counts, and in doing so we should get to see where the real heat of the pandemic lay as objectively as possible. No eyeballs, just algorithms!
As we have already noted there were weeks when counts during the pandemic year of 2020 were less than the prior 5-year mean; a strange fact I’ve gone and called out as the benign pandemic. Let’s just see how benign or not on a week-by-week basis by looking at the ARIMA model output using the rather funky expert modeller option:
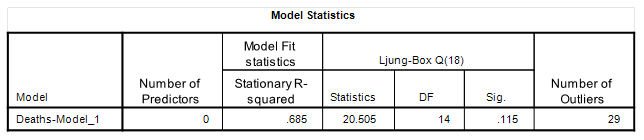
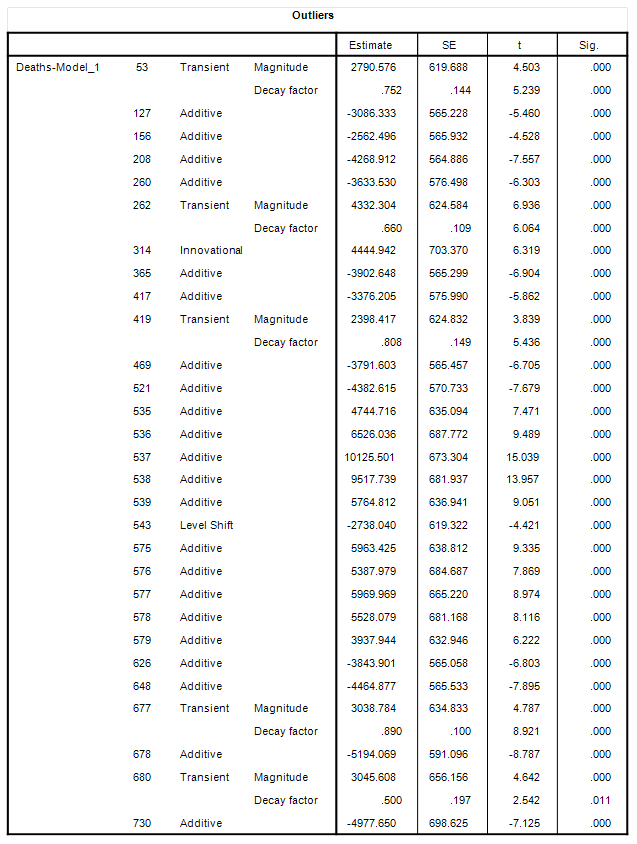
We now need to focus on the bottom table and, unfortunately, the ARIMA module spits out sequential week numbers rather than dates. For reference 2020/w1 is week number 522, 2021/w1 is week number 575, 2022/w1 is week number 627 and 2023/w1 is week number 679. Pandemic-wise we’re looking at week sequences beginning 530 or thereabouts for the first wave, 560 or thereabouts for the second wave and 575 or thereabouts for the third (post-vaccine) wave; and we’re looking for sizeable positive estimates under the column called… Estimate (does what it says on the tin).
Put all this in your basket and you’ll clock a consecutive outlier sequence that is 535, 536, 537, 538 and 539; these representing the first wave period of 2020/w14 (w/e 3 April 2020) – 2020/w18 (w/e 1 May 2020). Interestingly enough these are all classed as additive outliers and the reason for this is that the estimates vary significantly from an additional +4,745 deaths per week up to an additional +10,126 deaths per week when we round figures up; that is to say ARIMA wants to us treat these as individual events owing to the bouncy dynamics of the situation. Another consecutive outlier sequence of interest is 575, 576, 577, 578 and 579; these representing the third (post-vaccine) wave period of 2021/w1 (w/e 8 January 2021) – 2021/w5 (w/e 8 February 2021). These weeks, being bouncy, are also classed as additive outliers.
This first pass over the data tells us what weeks need to be pruned if we are to fully exorcise the pandemic, and we may note it is just 10 weeks. Just 10 weeks folks, and that’s the only period we can honestly call a proper pandemic (in terms of all cause registered deaths, that is). The keen will spot two positive transients at week sequence 677 (2022/w51) and 680 (2023/w2), these likely arising from bunching of registration records at the year end.
There are negative-going outliers as well as positive and this is typical of registered deaths. Negatives become due for serious consideration when huge, when classed as a level shift, or when they pop up as a consecutive sequence. In this regard week 543 (2020/w22 – w/e 29 May 2020) crops up as a level shift to the value of -2,738 deaths per week and it’s worth cogitating on what may have caused this. Either the big bad virus magically went away/instantly mutated to a less potent strain that didn’t kill quite as many every week from this point on… or the NHS decided to change tactics for COVID case management… or the NHS decided to open its doors again and run diagnostic tests and/or elective procedures to save the lives of everyone else like before. We’re also possibly looking at changes in the care of the elderly and sociological impacts etc etc etc.
Whatever the cause of this lessening in the weekly death toll it got going rather suddenly at the back end of May, and it is worth reading those definitions for outliers carefully again, for level shifts in a time series are nearly always associated with policy changes at the national level. Did somebody somewhere decide it was time for the pandemic to magically go away?
Reaching For the Secateurs
Now that ARIMA - in blazing guns outlier mode - has identified the precise position of the pandemic1 we need to cross check this by creating a set of dummy variables representing the 10 weeks that have been identified and, while we’re at it, we might want to add a few more indicators just in case adjacent weeks slipped through outlier detection.
I’m not going to reproduce the final model output here because it is rather wieldy, though keen readers may wish to note a slight extension to the precise location of the pandemic with the first wave now being defined as 2020/w14 – 2020/w20, and the third wave now being defined as 2021/w1 – 2021/w6. Use of indicator variables also served to refine estimates of additional weekly deaths.
With such sophistication in place we can go ahead and use the estimates of additional weekly deaths for these hot periods to prune the raw data. This is what the series looks like with that excision made:
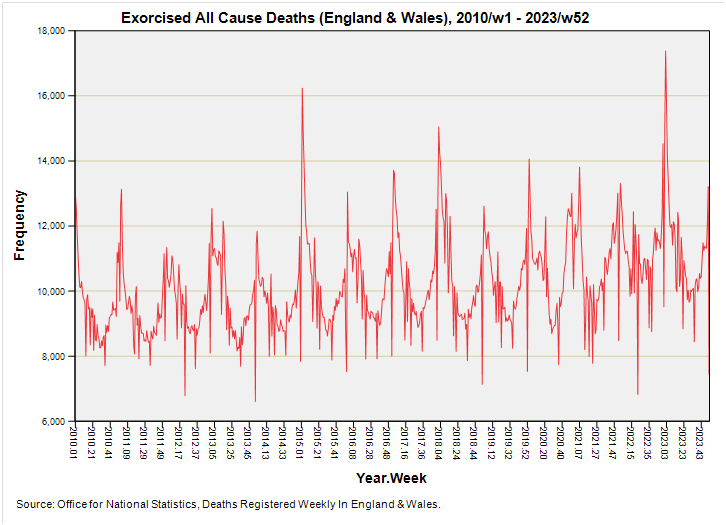
We can chew over this until the cows come home in terms of what it means, what we can do with, whether it is a valid approach, and so on and so forth. The exercise is essentially exploratory but the message we should be taking home with us is that the pandemic wasn’t a constant threat during 2020 when measured in terms of all cause registered death. We’re talking 13 weeks tops in two distinct phases. This is why I’m not keen on the broad brush approach that has been taken by the ONS that treats the entirety of 2020 as a ‘bad pandemic year’. It wasn’t, but the good news is that the ONS now acknowledge this in their recent report on the proposed new methodology.
I can portray the impact of the exorcism visually by plotting out pruned counts of all cause registered deaths by week and by year for the period 2020/w1 – 2023/52. Have a taste of this:
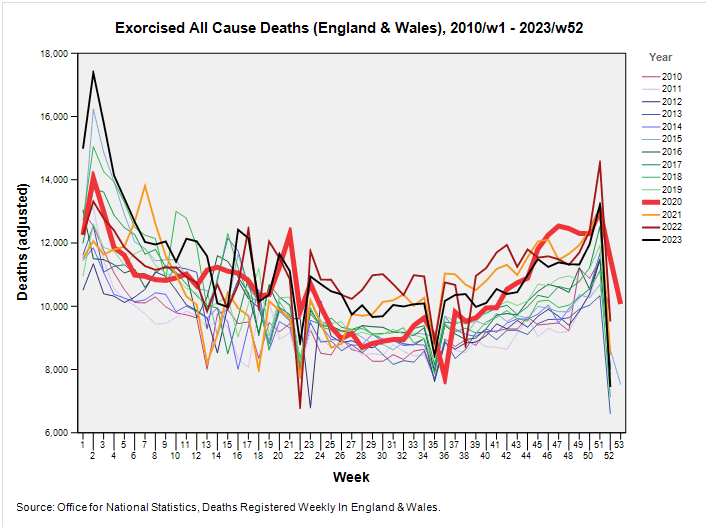
Scrummy, innit? With those 13 weeks for all cause registered deaths in England & Wales pruned using estimates of excess derived by ARIMA we find the pandemic of 2020 melting into nothingness. This is why we shouldn’t treat 2020 as a ‘bad pandemic year’ and why the previous ONS method of skirting around the issue ended with questionable estimates for excess death.
Before we skip to the next section we might like to clock the rather poor end to 2022 and the dreadful start to 2023 given the good folk of the land were all dosed up with the magical elixir that even prevents road accidents. Interesting.
Are Deaths Increasing Over Time?
One thing that will not have escaped the notice of fellow biscuit munchers is that the exorcised time series seems to be lurching uphill, so I better get some spanners out and check.
If I use the common or garden ordinary least squares linear regression wotsit (the thing that plonks straight lines down regardless of the error structure of the dependent variable), then we arrive at a positive slope estimated at an additional 2.42 deaths per week (p<0.001).
There are those who might frown on this and state that weekly counts of all cause deaths do not possess an error structure that follows the Normal distribution. They’d be right, of course, so I ran the linear wotsit again under generalised linear modelling (GLM) using a Tweedie error structure and this threw out a rate of 2.40 deaths per week (p<0.001). Sometimes more is less.
Then there are those who will claim this is all tommyrot and state that weekly counts of all cause deaths do not exhibit independence of measure; that is to say, one week’s value will influence the next week’s value. They’d be right, of course, so I ran an autoregression procedure using maximum likelihood estimation and this spat out a rate of 2.28 deaths per week (p<0.001). Sometimes statisticians need a slap round the head for wasting everyone’s time!
So yes, all cause deaths have been steadily increasing over the period 2010 – 2023, and we may cogitate on the many reasons why, starting with an ageing population and under-funding of health services. Whatever the reason (there are likely to be many) I’m going to have to account for this uphill lurching when it comes to estimating excess deaths. But first, I need to acquaint readers with a confection I am calling the seasonal mean…
Kettle On!
Is it just me or is this a very strange thing to say for an alleged novel and deadly virus trying to wreck an entire population?
I'm curious what just the excised outlier plot looks like because it would indicate when we were doing senseless interventions.
I can't claim to understand your stats very well, but as a policy lawyer with 23 years of experience now, and having studied pandemic policies quite thoroughly over the last four years, I can vouch for the notion that what you're seeing in the data may well have been caused by policy changes.
Here's one rather stark example I wrote about a while back: https://medium.com/@tamhunt/the-math-of-false-positives-shows-chinas-lockdowns-are-unnecessary-and-constitute-human-rights-6bcc448566f1.
And this one: https://medium.com/@tamhunt/how-california-made-the-pandemic-worse-29df15246df7.
And this one: https://medium.com/@tamhunt/the-three-policy-changes-that-may-avoid-the-next-pandemic-9c6066639924