
Exploring Excess Death (part 5)
I investigate alternative methods for estimating excess death using ONS weekly registration data from 2010 - 2023

Method #3: Subtracting The Seasonal Mean
So here we are at the third method and what I shall be doing today is subtracting the de-trended seasonal mean series as described in part 4 from observed weekly counts for all cause death for England & Wales. This is a stationary series in time analysis lingo meaning it doesn’t trend upward or downward in the longer term and merely oscillates around a central mean value of 9,272 deaths per week. What matters here above all things is the seasonal pattern. Herewith the difference series revealing the weekly excess:

Herewith the cumulative excess:
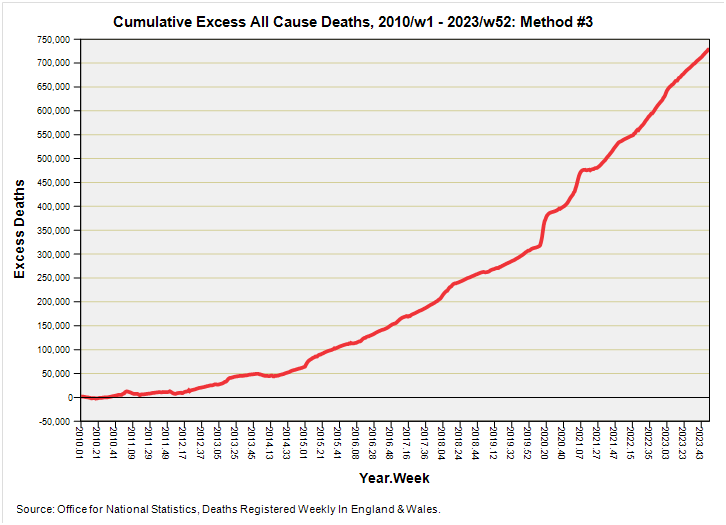
OK, so we have a result here that is sooooo different that I had to stall the session and go and examine the LOG file in which every single command is stored: I had to check I’d done the right calculation with the right variables and saved the right file and plotted the right graph. It transpires I had done all of these things.
If we subtract the seasonal mean whose derivation was explained in part 4 we end with a smooth ramp of excess death that builds from 2010 onward. The kink of the pandemic is now almost lost in the clamour of ever rising excess to the point where one of my eyebrows is stuck on the ceiling!
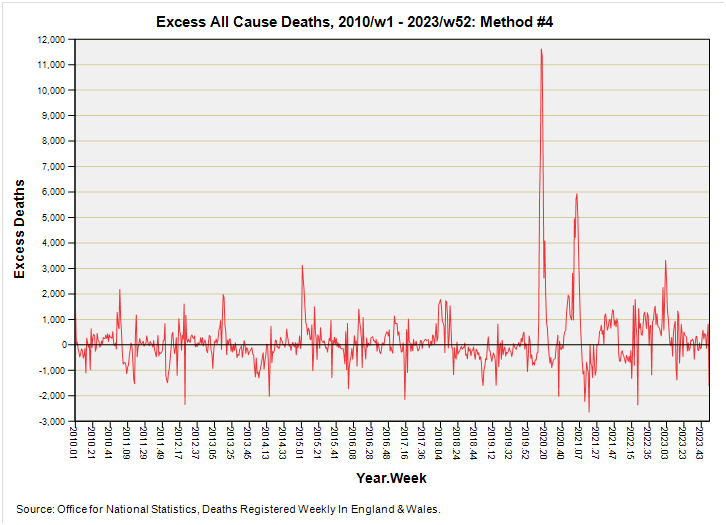
Method #4: Subtracting The Seasonal Ramp
The ever building excess we’ve just swooned over comes about because there’s a general trend toward greater numbers of deaths that I briefly explored toward the end of part 3. If these are assumed to follow a linear trend of an additional 2.28 deaths per week then we can bend the seasonal mean upward by this amount to account for the underlying trend as well as the seasonal wiggy-jiggy component. I’m calling this confection the seasonal ramp and when we use it for our baseline we arrive at this series for excess all cause death:
Herewith the cumulative excess:
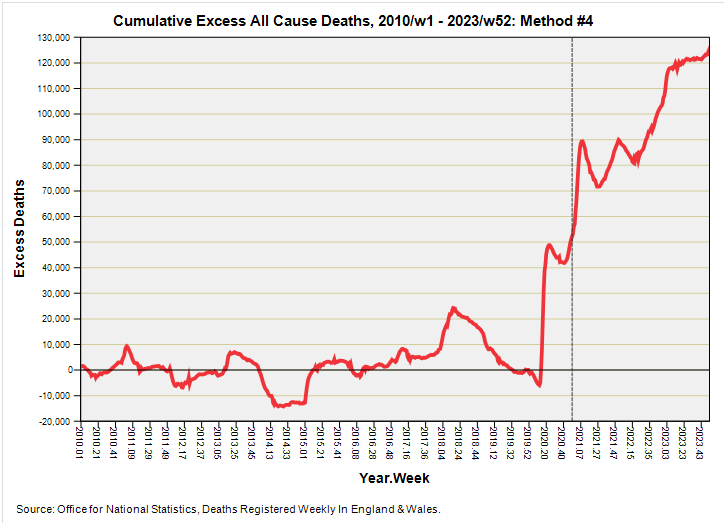
How much more different could that curve be? Quite! By accounting for the underlying upward trend in all cause death as well as the regular seasonal component we’ve flattened out the time series all the way up to spring 2020 when the pandemic explodes onto the scene in dramatic fashion. The vaccine was supposed to stop all this when it rolled out in 2020/w50 (marked by grey dashed line) but it obviously did nothing of the sort and excess all cause death has continued to accumulate with no end in sight.
The thing about these cumulative excess death curves is that they’re supposed to bob about the zero axis as diseases and events come and go. People can only die once, so a flurry of death in one period is marked by an absence of death in the next and so on, and so forth. Think see-saw. If the curve keeps climbing it means that whatever is causing the situation hasn’t gone away. Pathogens don’t behave like this for they come and go, so we must ask ourselves what is persistently attacking the public at large. Vaccine harm obviously springs to mind but there will be other factors. The big question for me is not what is driving this excess (we can guess) but why His Majesty’s Government are not bothering to command an authoritative investigation that surely is of the utmost national importance. I can only presume they avoid the obvious because they fear they’ll not be able to sufficiently nobble the committee and/or quash the evidence.
Comparison of Methods
At this point I am itching to directly compare methods and I guess you are too! Grab a bite and feast on this:
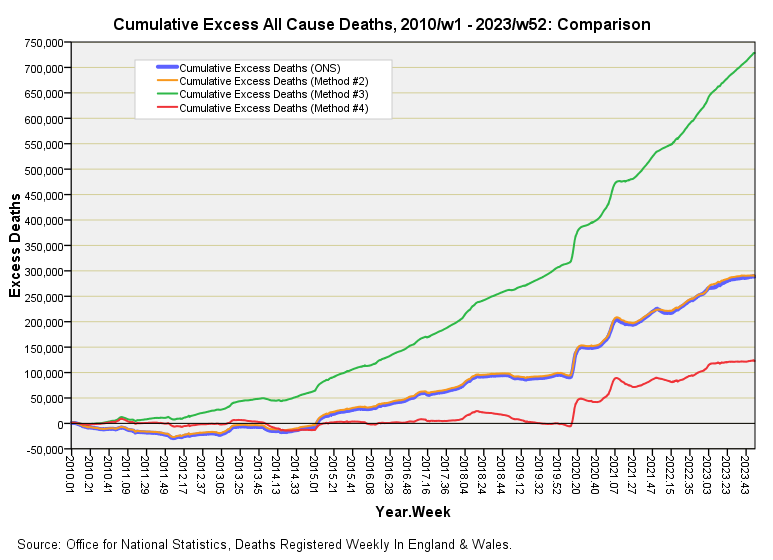
My second method – subtracting the exorcised 5-year baseline – turns out near identical results to the former ONS method1, which is to be expected since we’re both avoiding the pandemic peak of 2020 one way or another. But that’s where the happy ending… er… ends. Using a de-trended seasonal mean baseline (green) leads to a gazillion excess deaths that swamp the pandemic whereas a trended seasonal mean baseline (red) brings the pandemic into sharp focus and provides a more conservative estimate for excess death. This is not exactly an exact science, is it?
The issue here for me is what makes for the most sensible approach to estimating excess all cause death when the death tally is increasing over time. If there’s nothing that can be done to reverse that underlying trend (e.g. an ageing population) then it makes sense to incorporate it into calculations so we may more easily spot deviations. If that trend is originating from government policies (e.g. austerity measures and under-funding of the NHS) then it makes sense to stick the bad news right under a Minister’s nose.
Adoption of the prior 5-year method looks like it is saying something of value until you realise that the rate of historic death is defining the level excess as much as the observed weekly counts, with low historic rates inflating the figures (and vice versa). We may view these curves as saying ‘this is what is happening in relation to what happened over the last five years, but what happened over the last five years may not be representative.’
That doesn’t sound that wonderful to me! It is what it is: a confection like any other.
But there are other ways…
Ah, I'm afraid... there are ways in which he can return. Harry, do you know why the Office for Nobbled Statistics couldn't bear to have you touch them? [Harry shakes his head] It was because of your baseline. It sacrificed itself for you, and that kind of act leaves a mark. [Harry reaches up to touch his scar] No, no. This kind of mark cannot be seen. It lives in your very time series.
Kettle On!
Looking at your top graph here, my eyeballs would split this into three parts - up to 2014/15 there is a constant average around 500. From 2015 to 2020 it shifts up to double that - nearer 1000. Then post 2020 it shifts up to double that again and with increasing variance/variability. We know what happened in 2020 ... did any significant health events occur in 2014/15? or am I imagining it?
Lets all sing together: (In four part harmony, to the tune of a 12 string Hawaiian Guitar - we can call ourselves John Dee and the Amazing Kup Kakes for all I care) ....
"No Pandemic - there never was a Pandemic"!
The biggest single clue in all this was the median age of those who died of/with Covid, which was always higher than the usual life expectancy. 82. So, mostly born in the 1930's and 1940's.
So, the 1940's Pre-Boomers did very well really, up to a point, being generally rather a sensible and compliant generation, mostly blue-collar workers born into WW2 Austerity, and being a rather mild winter of 2019, many of them managed a few extra months of life, but sooner or later, those Pre-Boomers had to Bust - and Bust they did.