Do COVID Vaccines Work? (part 6)
In this article I utilise data from an unknown NHS Trust to forge multivariate logistic regression models in the prediction of vaccinated deaths with special reference to hypertension
In part 5 of this series I stumbled across a rather unexpected finding that linked vaccinated deaths with incidence of COVID and hypertension such that that those suffering from high blood pressure concomitant with a positive test result prior to death were more likely to have been vaccinated – 68.4% more likely to be precise – than unvaccinated counterparts. Split-file logistic regression revealed this to be a feature of the later period (2021/w19 – 2021/w37; OR = 3.801, p=0.001) but not the initial period (2021/w1 – 2021/w18; OR = 1.392, p=0.135). In plain English, vaccinated deceased in the later period are nearly four times more likely to be suffering from COVID in conjunction with hypertension than unvaccinated inpatients. This morning I elected to push the boat out further on model structure, but let me explain what I mean by ‘pushing the boat out’…
Split-File Sugar Substitute
Up to now I’ve been resorting to split-file methods to minimise artefact arising within the modelling of data collected over the heterogeneous period 2021/w1 – 2021/w37. Time doesn’t stand still and neither did disease prevalence, viral strain, provision of diagnostic and therapeutic services, government policies, people’s attitudes and vaccine uptake. Everything was changing all of the time, which makes analysis pretty darn tricky. This leads to negotiation of the minefield set by Simpson, being a minefield so darn cunning that explosions can be heard daily, with peer-review in prestigious journals offering little or no protection. I’ve got a few shrapnel wounds myself.
Splitting that 38-week period into two 19-week periods labelled ‘early’ and ‘late’ offers a degree protection from Simpson’s paradox, and gave some insight into generation of the illusion that is vaccine benefit. However, with only 8,714 deaths to consider in the first place, then slicing the dataset in half in the first instance brings its own set of problems. I have thus resorted to trying a little trick and that is to utilise an indicator variable I have called ‘Period’ that delineates the early and late vaccination phases. On its own Period doesn’t do or say very much, but when placed in an interaction such as Period*COVID Dx, then it comes alive and tells us things.
Ingredients & Interactions
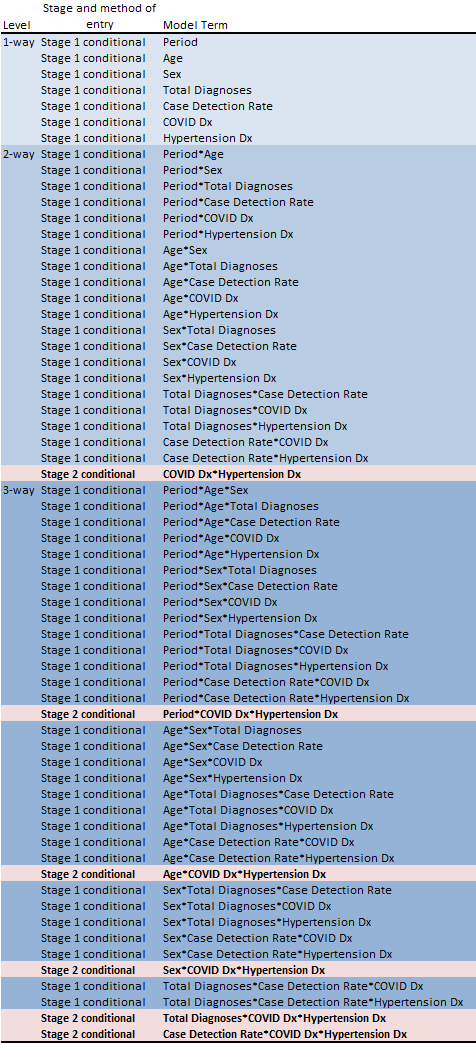
Let us then have a look at the seven independent variables and their 56 possible interactions that I am going to use in a logistic regression for the prediction of vaccinated deaths, with emphasis on incidence of positive test result and hypertension:
There they all are, and I’ve colour-coded the interaction level in subtle blue hues to make eyeballing easier. This is what statbods call a factorial design, which means that I’ve included all possible combinations of the 7 variables up to 3-way. You’ll see a whole bunch of terms marked as ‘Stage 1 conditional’ - these are the terms that I’ll conditionally submit in the very first modelling stage in order to soak up as much background variance as possible. Think of this as using a heavy roller to flatten the wicket and level the field before play. ‘Conditional’ in this instance means each term must reach the 95% level of confidence to permit inclusion (p<=0.05), with the model building in a progressive (forward) manner.
Once all statistically significant terms have settled within stage 1 (think demographics on steroids) the modelling process moves onto stage 2 where the key interactions of interest are subject to significance testing in the same manner.
Freshly Baked Odds Ratios
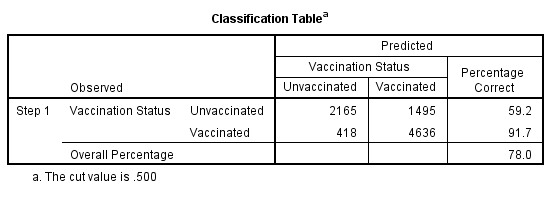
We shall start with the classification summary table, for if the model can’t predict vaccination status at death for toffee then we might as well all go home and drink cold beer:
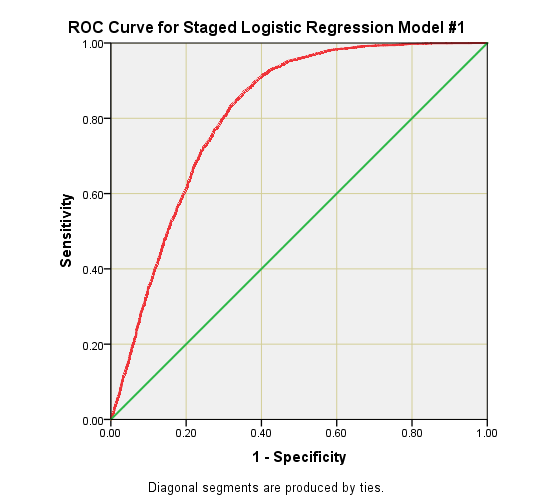
A logistic model of 10 terms plus a constant managed a true positive rate (predicting a deceased person had been vaccinated when they had been) of 91.7%, which is going some. Performance on the true negative side (predicting a person had not been vaccinated when they had not been) was mediocre at just 59.2% but this is better than a slap in the face with a wet halibut and, in fact, is a rather reasonable rate for predicting outcomes in the complex realm of healthcare. Those who like to ogle ROC curves and their statistics may do so below…
IMHO this is a rather natty discriminatory model in which we may place a fair degree of confidence, so we better grab a decent pot of hot coffee, open the biscuit tin and pull up the table of model coefficients for consideration:
Getting The Jist
To get the jist of these 10 terms we need to consider them in context of the monster list of raw ingredients that were submitted in two modelling stages, for what is omitted is just as telling as what has passed p=0.05 muster.
For example, we don’t see the term Hypertension(1), this is because it failed to reach statistical significance at stage 1 (p=0.914). In plain English this means there isn’t a general tendency for the vaccinated deceased to be suffering from high blood pressure compared to unvaccinated deceased. Neither does this change over time because the interactive term Period(1) by Hypertension(1) also fails to reach statistical significance (p=0.407). This is a blasted mystery for this goes against the in-your-face split-file result discussed in part 5. The word is bottoms and I will need to investigate why this is so!
Neither is there a tendency for hypertension to be associated with a particular sex, for the interactive term Sex(1) by Hypertension(1) fails to reach statistical significance (p=0.650). In fact, there are no ‘sex effects’ whatsoever, which itself is rather interesting and is forcing me to chew my pencil.
Surprisingly, neither is hypertension a function of age, for the interactive term Age by Hypertension(1) fails to reach statistical significance during stage 1 (p=0.892) . This counter-intuitive finding might throw some readers but we have to set this result in the context of effective prophylaxis keeping blood pressure down in the elderly, along with incidence of hypertension in the younger generation as well as the older generation. Hypertension strikes at any age!
We discover that hypertension in the vaccinated deceased only crops up in association with a positive test result, and especially so for those with a greater number of diagnoses entered on their medical records: COVID Dx(1) by Hypertension(1) by Diagnoses (OR = 1.093, p=0.006). We might argue that COVID is causing the hypertension but if this was the case then this would equally apply to the unvaccinated deceased and thus vaccination status at death would be irrelevant. The fact that this term crops up at all means there is a decided link between vaccination, incidence of COVID (positive test result) and hypertension, and especially for folk who have a lengthy diagnostic record. The simplest explanation I can come up with at this stage is a form of vaccine harm.
Curiously Crusty Ratios
Sitting in that table are terms that make sense and some that are most curious to the point of being crusty. We expect an odds ratio greater than 1.0 for Age (OR = 1.048, p<0.001) since rollout was age-prioritised and older people were more inclined to take the jab, hence proportionately more older folk will be present in the vaccinated deceased cohort. Equally, we expect an odds ratio greater than 1.0 for Diagnoses (OR = 1.268, p=0.012) since those with lengthy medical records are more likely to have been vaccinated in a rollout programme aimed at the clinically vulnerable.
Case Detection Rate (OR = 0.179, p<0.001) is where things start to get wrinkly. This ratio of less than unity is telling us that there is less likelihood of a vaccinated death when disease prevalence amongst the population is high, conversely there is more likelihood of a vaccinated death when disease prevalence is low. This sounds bonkers but it is merely an artefact arising from the passage of time – vaccine uptake progressed as viral infection petered out leading to an inverse relationship.
If we ignore the association with hypertension for a moment then positive test results feature in two model terms: COVID Dx(1) (OR = 0.338, p<0.001) and Case Detection Rate by COVID Dx(1) by Diagnoses (OR = 1.015, p=0.133). Folk may say, “but how come that 3-way interactive term is insignificant and yet is included in the model?” A good question! What has happened here is that the term was deemed significant at stage 1 (OR = 1.021, p=0.028) but has been knocked from its perch at stage 2 by incorporation of COVID Dx(1) by Hypertension(1) by Diagnoses, this interaction being a better fit to the data thus forcing redundancy of the stage 1 term.
It is interesting that Case Detection Rate by COVID Dx(1) failed to reach statistical significance at stage 1 (p=0.891) because common sense would suggest that positive test results are going to be more likely when disease prevalence is higher, even for vaccinated folk. The fact that it is not indicates little or zero correlation between incidence of a positive test result and nation-wide infection rates for vaccinated folk prior to death – a finding that should raise more than an eyebrow because we’re not talking about a magical elixir, we’re talking about a real world therapy. I find this most suspicious.
Some may argue that this factor is confounded by the passage of time but if we pull up Case Detection Rate by COVID Dx(1) by Period(1) from stage 1 we find this to be statistically insignificant also (p=0.159). In the real world incidence of a positive test result must be linked to disease prevalence (assuming a genuine virus and assuming a genuine test for that virus); the fact that this is not the case for those vaccinated prior to death suggests something murky may well have been going on in the selection of inpatients for testing, or in the subsequent coding of their medical records. While we’re at it we also ought to consider the validity of the PCR test and of claims of a circulating novel and deadly virus. I feel another investigation coming on…
When it comes to assessing the value of a positive test result as a predictor of vaccinated death we must carefully consider the interactive term Age by COVID Dx(1). This doesn’t feature in the final model because it just failed to reach statistical significance at stage 1 (p=0.066). This is unfortunate because a great deal hangs off this; let me explain. COVID is primarily supposed to a disease of the elderly, who were targeted by an age-prioritised rollout programme for this very reason. We may thus expect to see greater benefit of vaccination amongst the deceased elderly in terms of reduced incidence of a COVID diagnosis at death and less of a benefit amongst the deceased young: what I am describing here in reasonably plain English is an age-COVID interaction.
The fact that the term Age by COVID Dx(1) doesn’t pass muster at the 95% level of confidence when it should be shouting from the rooftops suggests something is amiss. One possibility is that COVID designation within medical records is not pointing at anything genuine (e.g. false positives, asymptomatic cases that die from non-COVID causes), and the other possibility is that the association of COVID death with the elderly has come about not through severe COV-SARS-2 infection per se but through diabolical patient management, including inappropriate application of end-of-life protocols and withdrawal of medicines including life-saving antibiotics for the treatment of bacterial pneumonia. This lack of a credible interaction term for age and COVID is mightily important and I shall be investigating this matter further: something ain’t right!
Coming Up For Air
I’m hoping readers have got a handle on my hard crust baking this morning. There is mounting evidence of ‘funny business’ that may partly be explained by a reluctance to conduct tests on vaccinated inpatients, which gives rise to instant vaccine benefit. This may have been a deliberate move from on high to disguise the fact that the vaccines are not working to prevent COVID as claimed. Down at the coalface this probably seems like a jolly good idea to health professionals because it reduces their workload (and departmental running costs) and avoids bothering inpatients who would have been rather sick in the first instance. It would also serve to reinforce the narrative among health professionals who, believing in the effectiveness of the vaccines, would otherwise start to question why NHS top brass has decreed they should be rigorously testing vaccinated inpatients for COVID.
This is a tricky issue to tackle for rebel analysts don’t have access to the medical casenotes proper, that hopefully record when viral tests were undertaken for both vaccinated and unvaccinated inpatients. This would make for a cracking little clinical audit, and if I were still in the saddle I’d be looking for volunteers amongst the research and development nurses who tend to question their unit’s practice more so than head-down senior house officers who generally can’t be arsed with clinical audit until the consultant grumbles.
A way of tackling observation bias in the absence of medical casenotes is to ignore the test results and use the diagnostic fields to determine incidence of COVID ‘proper’ (i.e. symptomatic COVID) – something I shall be doing shortly. Meanwhile, we need to ponder on the finding that hypertension is linked to vaccination status and incidence of a positive test result in those inpatients who didn’t manage to survive their stay. Unlike the ‘experts’ I’m putting this down to vaccine harm unless I can knock the result off its perch; it’s safer that way. Until next time…
Kettle On!


Simple human instincts have been telling us that many things were fishy & definiitely not right about the whole covid racket since the beginning. You are doing an outstanding job of demonstrating those feelings to have been well founded, so I trust you are taking additional steps to bolster your personal security. You do not want to follow in Dr David Kelly's footsteps.
I also applaud your efforts to achieve better biscuit supplies, but . . . GoFundMe? Those evil bastards who stole millions of dollars from the Canadian Freedom Convoy? And passed bank details to allow the Canadian government to freeze donors' accounts? They could do the same to you, as a non-conformist, fact based questioner of the narrative. Shun them!
Other percentage taking platforms are available, such as the one Andrew Bridgen is using - https://democracythree.org/en-gb/en-gb/the_day_democracy_died_andrew_bridgen . And loads of others here https://blog.fundly.com/gofundme-alternatives/ .
Is the hypertension consistently defined? Is it a yes/no thing or a numeric variable?