
Exploring Excess Death (part 8)
I change tack and explore ARIMA model residuals in time series modelling of ONS all cause weekly registered deaths for 2010 - 2023

An earlier comment by an astute subscriber got me thinking. They wanted to know what the pruned fragments for all cause registered death looked like back in part 3 when glued together as a series. We may think of this as the scraps of pastry that fall to the table as we trim our pie crust.
Whenever we produce a model – ARIMA or otherwise – we always end up with trimmings on the table that we call ‘residuals’ and it occurred to me that a time series of ARIMA model residuals might say something important about what was not expected to happen if death in the UK chugged along as ‘normal’.
To get a goodly amount of pie crust trimming we need to run ARIMA without goodies like indicator variables for pandemic weeks and without outlier detection, but we do need to run it with the seasonal mean serving as an independent variable that stamps out the basic pattern of seasonal variability for all cause death in England & Wales. We also better adopt the seasonal mean series that incorporates the slight upward trend in the death toll that was identified and estimated back in part 3. The final must do is to remember to ask the ARIMA module to save the residuals so we can maul them!
Yer Model
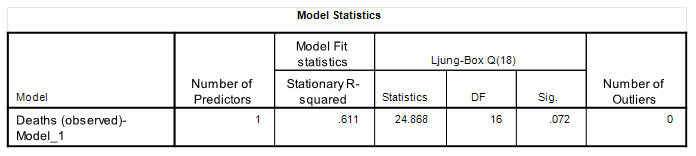
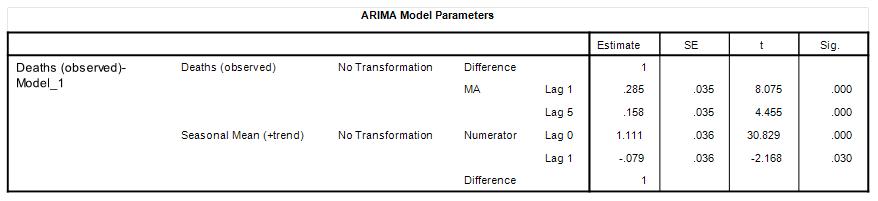
Herewith the tabulations generated by an ARIMA(0,1,5) model using the rather fancy expert modelling option within my stats package:
And herewith the time series for the residuals yielded by this base model:
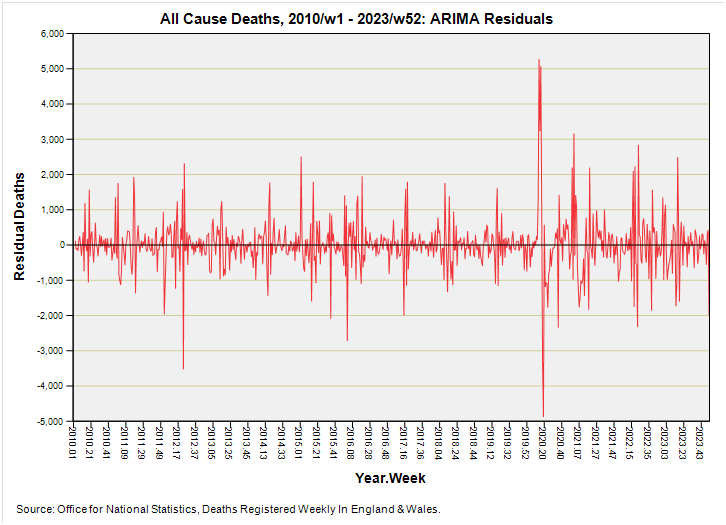
We should note how wonderfully the series wraps itself around the zero axis, with an overall grand mean of -1.18 all cause deaths per week. This is a good sign for it means the ARIMA model has squeezed out the seasonal variance in an unbiased fashion over the entire period 2010/w1 – 2023/w52. In an electronic engineering sense we’re not left with any significant DC current that needs to be offset by fiddling with one of those tiny little potentiometers that never seem offer smooth gradation and always seem to require a non-conducting screwdriver that you don’t possess!
Though this slide looks like the razed random remnants of a well-filled pie I checked this by running a Wald-Wolfowitz runs test, which indicated that the residual series is indeed a random walk (p=0.925). In plain English there’s no pattern left, which is a good thing ‘coz if there was a pattern left then I’d have to slap the model about a bit more.
Being Brave
I shall bravely suggest that if we take away the spring 2020 spike we’d never guess that a pandemic had occurred; at least in terms of all cause death residuals, that is. I don’t know about you goodly folk but I like my pandemics to have real-world weighty meaning like plenty of death or serious illness; I’m not keen on this watered-down WHO-driven drivel of a pandemic merely being anything ‘novel’ they’ve detected after inventing a new test that really isn’t a test (and just because the WHO suits say so).
So, then, that’s a pretty sharp super spike… and it never occurred to that extreme level again. An odd thing indeed for a disease equated with the mortality rate for flu. My betting money (all of it, mind) is on the impact of disastrous policies rather than a genuine pathogen passing through a population. This is not new news but it seems truly independent analysts are doomed to repeat themselves in the hope that a few more people will listen with each iteration.
At this point what we can do is turn this time series into a cumulative sum:
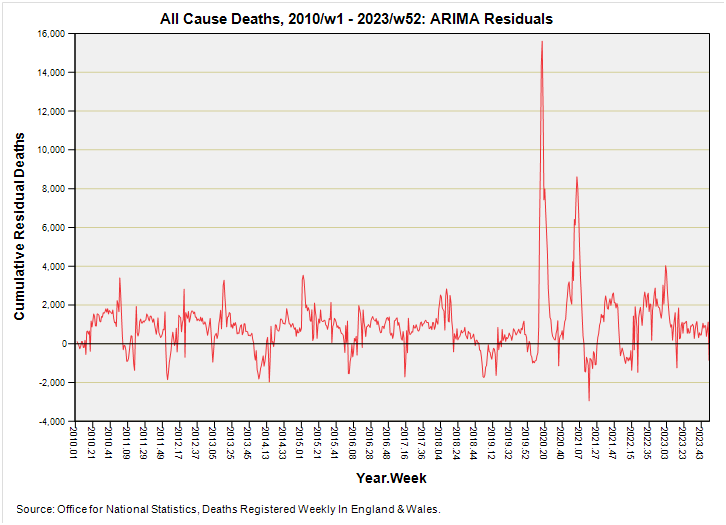
The cumulative series still hugs that there zero axis, though with a grand series mean of 927 deaths per week that is partly brought about by the massive spring 2020 death spike followed by the lesser winter 2020/21 death spike.
Whilst it is intriguing to speculate that the cumulative excess appears to move in a wave-like manner, we must take care to note that seasonality was largely eradicated using the seasonal mean baseline as an independent variable. We may therefore look upon these undulations as the extra-seasonal accumulations of quasi-random deaths. I’m not quite sure what this means, but it’s an excuse to chew on something!
I recommend folk don’t read too much into these wave-like patterns (or the DC offset) for even a residual series procured through application of a pure random number generator can throw up all manner of crazy when values are accumulated over time. I am sure electronic engineers will be familiar with this phenomenon in terms of signal drift on a noisy circuit.
There are no prizes for guessing where the pandemic lies but there is a chocolate chip cookie up for grabs for noting that the series ends with a modest positive cumulative residual of around 1,000 deaths per week, this being much like the pre-pandemic cumulative weekly residual. Whatever COVID was has come and gone; more than that, even: COVID was simply that single early and most suspicious death spike that had no reason to be.
What Happened To Excess Death?!!
I’m pretty sure at this stage that some folk will drop their toast butter-side down and ask where all the excess deaths have gone that I’ve carefully derived and plotted out in previous articles. Where they’ve gone is into the pie filling rather than the pie crust! That is, they’ve been modelled out of existence by a model designed to do just that.
If we want to use this technique to derive excess deaths (as opposed to residual deaths) then we need to set the model calibration period to the pre-pandemic era of 2010/w1 – 2020/w10 and obtain a forecast against which observed deaths are judged. In essence what I’m chasing here is not excess death but perturbations in the death tally on a week-by-week basis. With that said we better get another slice under the toaster…
Kettle On!
Please don’t forget the five second rule when staring down at the dry backside of one’s dismounted toast.
“COVID was simply that single early and most suspicious death spike that had no reason to be”
The first two letters of COVID may be a clue: Covert/Coordinated Operation