Pandemic En Croûte
Something a little special for independence day: using generalised linear modelling to reveal just how flaky the pastry is (rev 1.0)
The traditional recipe for a pandemic uses just two ingredients that are lightly flambéed in a copper vessel, these being people and a virus. A variant on this is pandemic en croûte in which we find people wrapped in a crust of politicians over a thick layer of irresponsible mainstream and social media, and dusted with extraordinary amounts of unnecessary viral testing. Surprisingly, pandemic en croûte doesn’t need a bold virus as such; just a few breadcrumbs seasoned to taste and look like a virus sufficient to fool even the most critical of food critics. A bit like a Gregg’s sausage roll.
Independence Is Key
Today I am going to reveal a few secrets behind the art of baking a good pandemic en croûte and the most important tool will be a well-chilled rolling pin we call generalised linear modelling (GLM). We must start with a basic equation:
Equation 1:
Cases being detected = what the virus is doing + what is happening on the testing front
That little ‘+’ sign is very important, for in the world of the statistician it denotes independence. That is to say, the virus can do its own thing independently of what the Test & Trace crew and folks poking noses at home, school and work get up to. Equally, it means that the Test & Trace crew and those poking folk can act independently of what the virus is doing like, for example, poking lots of noses when there is absolutely no clinical need and forgetting to poke noses when there is absolutely a clear clinical need. It is only when the virus does its thing and the poking folk do their thing that we start to see genuine cases rise and fall. In the real world nose poking will not be completely independent of the viral dance as people react to an unfolding situation.
Regardless of the issue of independence it should not stretch the mind too far to realise that if we don’t know what has been happening on the testing front we cannot say anything about what the virus has been doing by consideration of the case count alone: no tests means no cases! This hasn’t stopped experts at Public Health England, UKHSA, ONS, UK GOV coronavirus dashboard, NHS digital and all the rest who point at large case counts and declare, “my goodness, what a big case count!”
Here’s The Thing
So here’s the thing. If the virus is powerfully doing its own thing amongst the population then it is going to be tricky to predict case counts from a consideration of the number of people tested and the number of tests undertaken alone (right side of ‘+’ sign in equation 1). We are going to need fancy extras like transmission rate and transmission growth rate, infection rates and measure of disease prevalence (left side of ‘+’ sign in equation 1).
However, if the virus is not powerfully doing its own thing and/or the viral tests are pretty much churning out random garbage then any measure pertaining to the left side of the ‘+’ sign in equation 1 is effectively meaningless and we can pretty much determine the number of cases detected from the number of people tested and the number of tests undertaken (right side of ‘+’ sign in equation 1), along with a healthy helping of random noise.
The Rolling Pin
If this makes sense so far then you’ll be able to figure that if I can successfully and accurately predict cases detected from just the number of people tested and the number of tests undertaken using some basic generalised linear modelling then we’ll have proof of pandemic en croûte and not a traditional pandemic. That is to say we’ll be looking at a Testdemic good and proper. But are we looking at a Testdemic? Let’s get our aprons on and go find out…
Ingredients For Generalised Linear Regression
Dependent variable:
Independent variables:
Pillar1R7D – Rolling 7-day new pillar 1 tests by publish date
Pillar2R7D - Rolling 7-day new pillar 2 tests by publish date
Pillar3R7D - Rolling 7-day new pillar 3 tests by publish date
UniquePeopleR7D – Rolling 7-day unique people tested by specimen date
VirusTestsPerson – Rolling 7-day virus tests per person
Model structure:
Poisson Loglinear (Fisher estimation using Pearson Chi-square)
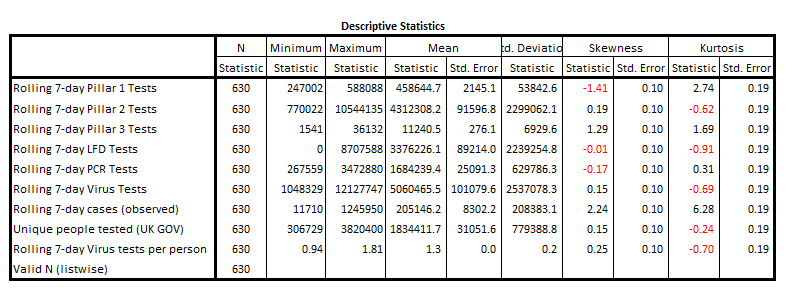
Descriptive Statistics
GLM Model Performance (16 Sep 2020 - 7 Jun 2022)
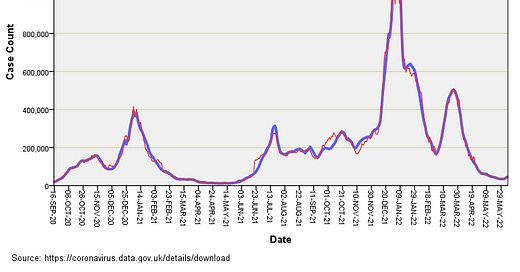
I’m not going to present pages of statistical output and tests of model adequacy, and shall get straight to the point with a slide of observed counts of rolling 7-day new cases and values predicted by generalised linear modelling from people tested and tests undertaken alone (GLM):
Is that a scorcher of a fit or is that a scorcher? In plain English I have predicted with precision what the daily case count was from a consideration of tests undertaken and people tested alone. A degree of fit of sorts is to be expected given inter-dependence of testing on viral dynamics but not to this extraordinary level of exactness! Somewhere along the line the virus should have done some independent stuff and made life difficult for the model, but it hasn’t.
If we calculate the Pearson correlation coefficient between these two series we obtain r = 0.993 (p<0.001, n=630), which is nothing short of extraordinary for it means that 98.6% of the variation in daily case counts across England is explained by variation in testing and people tested. This leaves 1.4% of the variation within the data that could be assigned to the virus doing its independent thing. This, ladles and jelly spoons, is proof of a fine pandemic en croûte! My compliments to the globalist chefs and the PCR pushers.
There is one interesting period where the red and blue lines do a little dance of divergence and that is Oct – Nov 2021, when observed cases start out fewer than predicted but end up more than predicted. That little jiggle of the blue above the red is what we’d expect if a genuine virus was doing a genuine thing amongst the population over and above what nose poking was going on. The rest is just flaky pastry.


Coming up... Pandemic Au Naturel whereby I go full geek and tackle serial autocorrelation within multiple regression in order to squeeze out a more robust model from my nozzle. Not for the faint-hearted.
Do the ONS not know this? They are (presumably thinking) statisticians aren’t they?