Exploring Excess Death (part 6)
I continue to investigate alternative methods for estimating excess death using ONS weekly registration data from 2010 - 2023
In part 5 of this series I finished with a slide comparing four different methods for estimating weekly cumulative excess all cause registered deaths in Englnd & Wales for the period 2010/w1 – 2023/w52. We observed a stupendous amount of variation between methods and I’m hoping this will have sobered readers good and proper!
When it comes to the slippery customer that is excess death no one method is ‘correct’ and no one method is ‘wrong’ for they all carry with them a bunch of pros and cons, along with degrees of sophistication, and all spread on some toasted assumptions. In essence, we are trying to compare the present with the past and this is always going to set us on a hiding to nothing.
I remember when I rolled out my first age-adjusted mortality time series for all cause death stretching from 2020 all the way back to 1970 in the original facebook version of the Almanac (now in mothballs). A rather aggressive group member told me in no uncertain terms that this was utterly pointless and misleading for so much had changed in the field of medicine. They had a point, of course, but even Mr Angry didn’t realise we’re not just talking about changes in medicine and disease when it comes to the death tally of a nation over decades. No indeed, for we are talking the kitchen sink, from drink-drive laws to seat belt wearing to nutrition, to water supply, to urban pollution, to food regulations to manufacturing controls, to public attitudes to austerity measures to housing standards and back. Mr Angry wasn’t best pleased when I repeated the analysis for the period 2010 – 2020 and came to the same conclusion.
Is it sensible to compare the present with the past when so much changes?
It depends. Even if we cannot assign causality we can grumble and rumble over what may or may not have changed and try to figure what seems to be working better now compared to back then. The alternative is to whittle wood and mend fishing nets.
Up to now we’ve used baselines in one form or another to anchor our analyses with respect to the passing of time but there is another way and that is to use a time series to tell us about itself. Yes indeed, we’re talking about ARIMA again!
The Idea Behind ARIMA
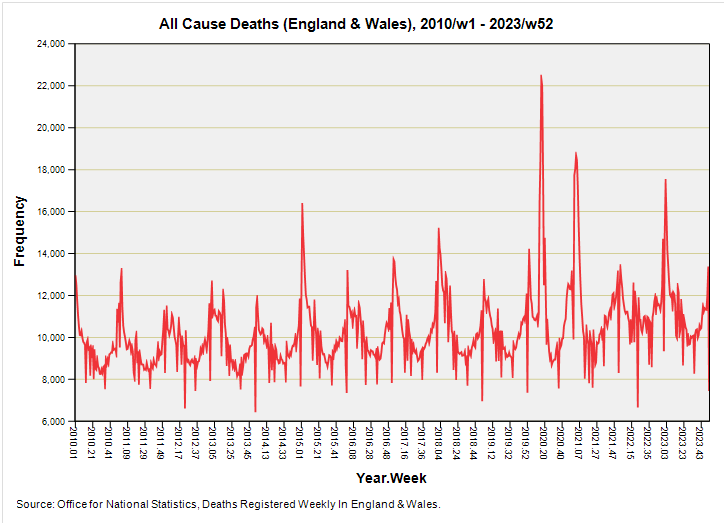
It’s probably best if I work through a real live example rather than mutter on so let’s start by establishing a model for total weekly all cause deaths in England & Wales over the period 2020/w1 – 2023/w52. Here’s what this time series looks like once more:
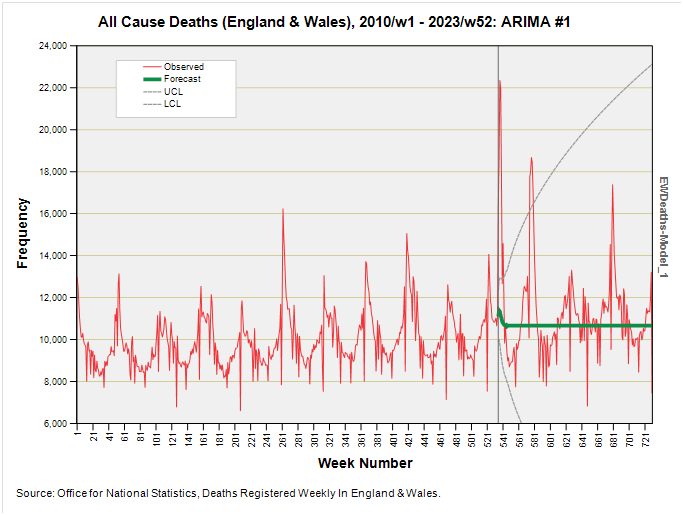
If I set the calibration base period to 2020/w1 – 2020/w13 (pre-pandemic) and get ARIMA to predict values for 2020/w14 – 2023/w52 (post-pandemic) we end up with a rather boring and completely ineffective ARIMA model that does this:
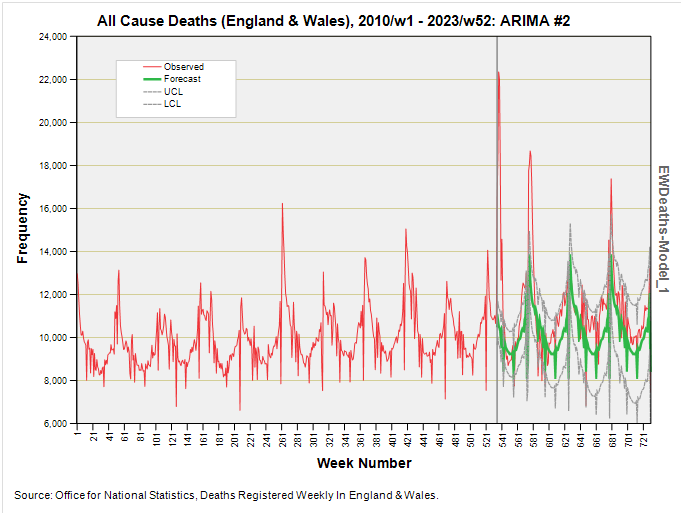
In a nutshell, there’s so much variation in the weekly count prior to the pandemic that ARIMA decides to dish out a simplistic structure that quickly resolves to a constant of 10,659 deaths per week. This isn’t that helpful so we better instruct ARIMA that there’s a strong seasonal pattern and the best way to do this is to use the seasonal mean baseline as an independent variable. This is what now drops out:
That’s better! ARIMA has now incorporated the seasonal mean as an independent predictor enabling it to track weekly deaths with more vigour, and this method is now beginning to look like it might furnish an alternative baseline to prior 5-year means.
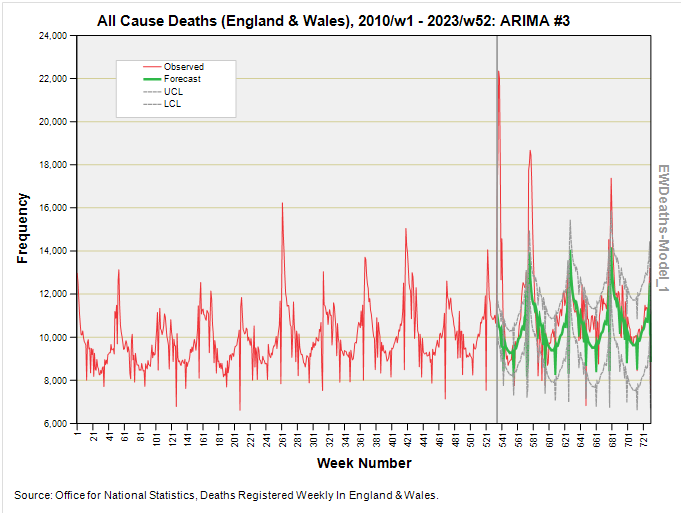
What we can do now is flip from using a basic (stationary) seasonal mean to one that incorporates the slight trend upward in weekly deaths over time that we detected in part 3. Here’s what the final ARIMA(0,1,1) model looks like with all bells and whistles:
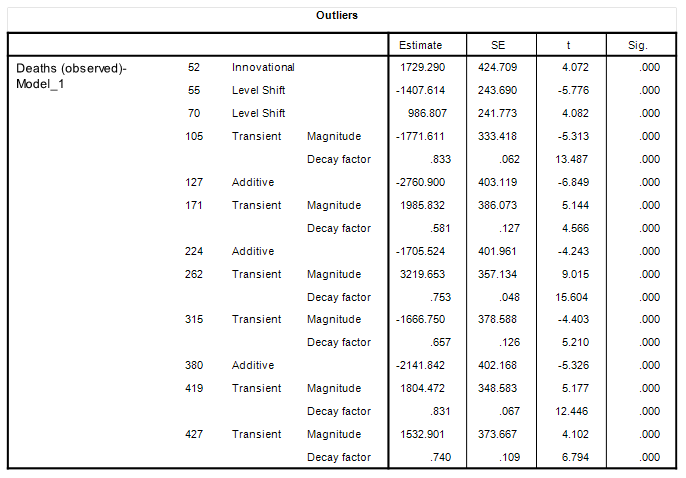
Herewith ARIMA model output for consumption by those who like this sort of thing:
So how did that final model fare in terms of producing a predicted baseline with which to derive excess deaths?
Let’s go crunch!!!!
Excess Deaths Using ARIMA
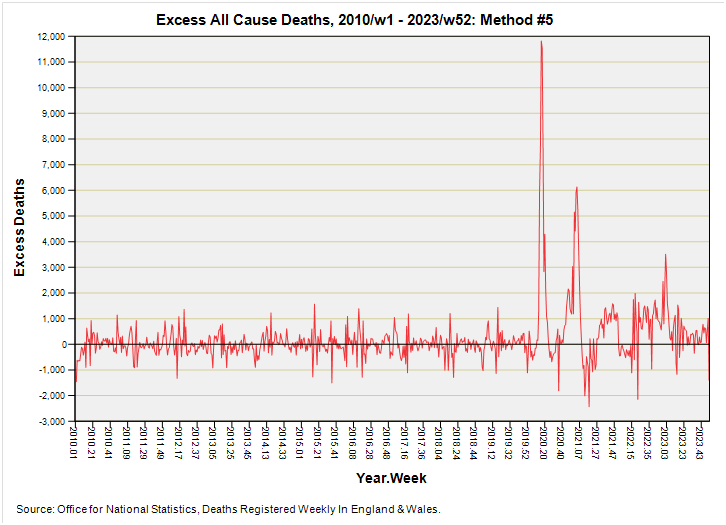
Here’s the time series for excess weekly all cause deaths looking very neat and tidy right up to the onset of the pandemic:
That initial jiggly-wiggly about the zero axis is a thing of gracious beauty and means that this technique has pretty much absorbed all of the variation arising from seasonality as well as underlying trend. We may say the playing field is now truly level!
This enables us to scrutinise what went on when the pandemic arrived, starting with that extremely strange and highly unusual super deadly sharp spike that I have hitherto called the catastrophic health collapse. There’s no way in my humble opinion that this can be attributed to the machinations of a virus alone; it’s as if a decision was made and the hammer came down across the nation in a highly synchronous manner.
One feature that should be getting our attention is the positive excess that creeps up on the nation after the second and third wave winter peaks of 2020/21. The magical experimental therapies were supposed to be taking care of the pandemic but it’s clear they did nothing of the sort.
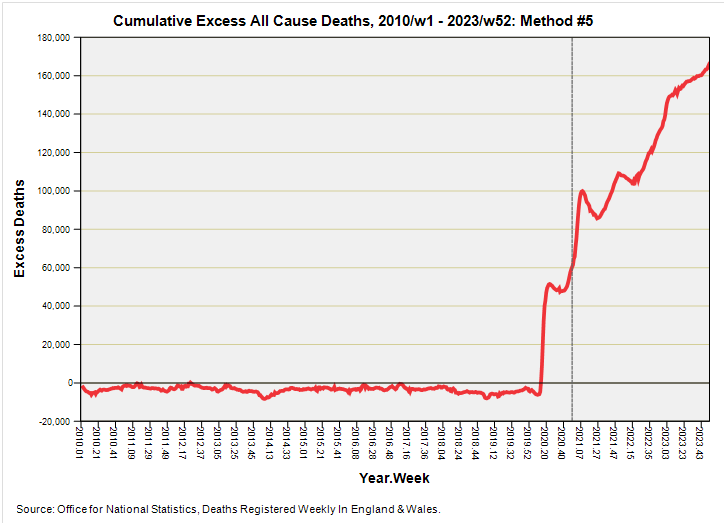
I guess we better go look at the cumulative excess:
Wowie zowie - how about that for hitting a brick wall?!!! I am betting good money that we are not looking at the impact of a novel and deadly virus unless that virus can mysteriously and magically emerge from all corners of the nations of England & Wales and kill folks in two weeks flat.
Since I cannot see how this is epidemiologically possible I am forced to conclude that these deaths must have occurred by other means, and it sure looks like they occurred to ‘order’. I am also wondering if that occult order may have been given again just prior to experimental therapy roll-out (marked by a grey dashed line).
And what about that curve that continues to climb? That’s not the passing of a pathogen, folks, that’s the hallmark of a persistent and deadly threat. If you wanted to know what a signal for vaccine harm would look like this is it. Anything else (e.g. suicide, death from intoxication, death from neglect, impact of service closure, viral mutation) would be showing signs of abating as we move away from the spectre of lockdown, but this is not the case.
Comparison Corner
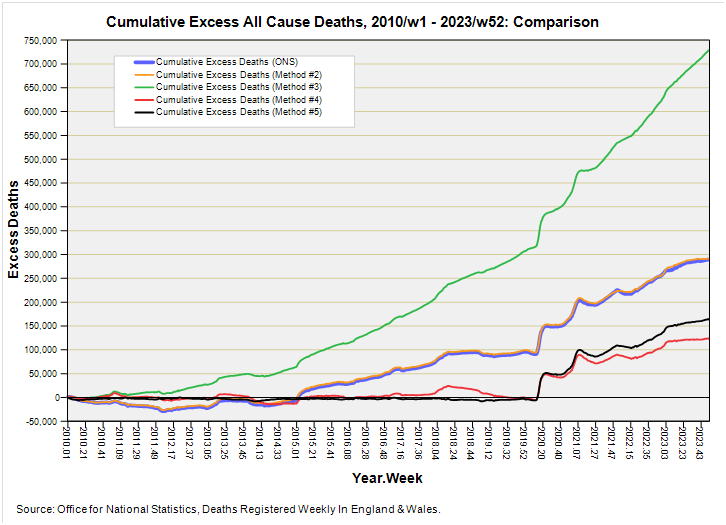
With a curve as fresh, fruity and vicious as this the next best move is to add it to my growing collection of curves. Try this:
As we may have guessed, this latest recipe using ARIMA modelling has produced a result similar to that for method #4 since both have the seasonal ramp (a.k.a. seasonal mean + trend) in common. What ARIMA has gone and done is absorb a bit more of the historic variation to give a flatter initial period, and it is thus rather interesting to observe a slightly greater cumulative excess building from the crunch moment in 2020.
Coffee & Cogitation
I need a pretty strong coffee after that. I’m not sure quite what to say about matters so grim so I’ll stick to the numerical aspect. It should be pretty clear by now that you can concoct all manner of baseline using all manner of method and these will give you different answers.
I’ve yet to sit down and pick my way carefully through the fine print of the new ONS method for deriving excess death for the nations of the United Kingdom but at first glance it is all looking and tasting rather good1, so much so that I shall relax with a plate of buttered crumpets.
Kettle On!
In so far as black boxes go.




Method 4. Nice one John, clear change starting 2020 but with different trajectories. The 2020 2021 spikes correlate with three different parameters. 1. Midazolam prescriptions for 5 NHS trusts 2. Mortality for 7 NHS trusts 3. Mortality by location of death (#1 hospitals, #2 Care Homes, #3 Home). I show all 7 Bradford Hill criteria met for "causation". Also 2022 2023 data is indicating something rather unusual.... Shush!... can't be mRNA.
Again superb. You would like to hope the policy makers that are placed above the vaccinators are quaking in their boots at what they have done, but at this point I’m doubting it. I think at this stage the lower echelons of the murder cartel are saying endless novenas and well on their way with making peace with their criminality.