Emergency Department Admissions: Analysis of CDS Dataset (part 11)
I analyse an anonymised data dump of 1.9 million admissions records to the emergency departments of an undisclosed NHS Trust for the period June 2017 – September 2021
Summary
Five weekly periods have been identified when the ratio of in-hospital to emergency department death was substantially and remarkably elevated, these occurring during lockdown (2020/w15 - w16 covering the period 3 April - 17 April 2020) and immediately after vaccine rollout (2021/w2 - w4 covering the period 9 January – 29 January).
The anonymised electronic patient records for a sample of 21,928 adult in-hospital deaths occurring between 1 January 2020 and 10 September 2021 for an undisclosed NHS Trust were subject to statistical analysis in order to identify correlates for the peculiar periods.
Staged multivariate logistic regression modelling was employed to verify correlates among 18 carefully chosen clinical variables. Acute respiratory conditions (OR = 1.54, p<0.001), other cardiac conditions (OR = 0.57, p=0.030) and hypertension (OR = 1.31, p=0.046) were identified as statistically significant discriminators for the two weeks during lockdown.
Appetiser…
That was going so well – what a shame that a neural network could produce some excellent results but then go and stir in a dollop of muck. There’s black boxes for you! After a bit of cogitation and a rooibos made with a teabag (yuck - I’ve run out of the fresh stuff) I decided to bring back our old friend the Logistic Regression. The trick here is to establish a binary indicator variable that doesn’t confound ‘normal’ periods with peculiar periods such that when we’re comparing those two weeks of peculiar lockdown death with ‘normal’ then normal doesn’t include the three weeks of peculiar post-vaccine death (and vice versa). No problems, guvnor, I’ll press these ‘ere buttons for ya.
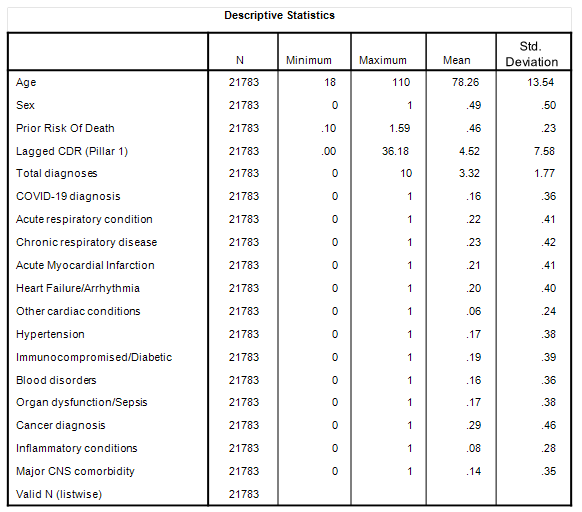
More likely to cause trouble than a spot of exclusivity is the selection of independent variables, and for this I decided to use the raft of fancies I’ve been using for some pretty hefty modelling these past few months. By way of reminder, herewith a summary table:
As before the column headed ‘mean’ provides the incidence rate of each condition for binary variables, such that we observe a mean of 0.29 for cancer diagnosis indicating 29% of all in-hospital deaths were flagged with an appropriate ICD10 cancer code in the EPR. Again this is not cause of death, and is merely ‘with mention of’ as they say.
Prior Risk Of Death (PROD) is a proxy variable I concocted in an attempt to account for general health prior to death. Yes, I appreciate that sounds daft, but some folk suffer many things for many years whereas others will succumb to one quick illness. If you’re geek enough to want to know more about PROD then this article is for you.
Lagged CDR (pillar 1) is another proxy variable, this being concocted in an attempt to account for prior exposure to the virus within a hospital setting (pillar 1) by deriving the case detection rate (CDR), being positive cases per 100 viral tests that was obtained 2 weeks prior to the date of death. You can read more in this article, this article and this article.
Asymptomatic and symptomatic COVID have been touched upon, these being positive test results with and without mention of a respiratory condition, the latter being anything from J00.00 Acute nasopharyngitis [common cold] through to J96.01 Acute respiratory failure with hypoxia. However, for this analysis I wanted to avoid the thorny subject of defining these categories and opting to use the COVID-19 designation as given in the EPR. By using interactive terms in the model I’ll be able to explore the link between test results and respiratory conditions, so all is not lost as we shall see! The rest of the independent variables are hopefully self-explanatory.
Sharp-eyed readers will want to know why I’ve dropped from 21,928 deaths down to 21,783 and this is because I’ve narrowed the sample down to adults aged 18 years and over to avoid neonatal and infant deaths influencing the analysis.
Logistic Regression Results: Lockdown Period
A blocked model design was used in which demographics and their interactive terms were considered first, these being:
Age
Sex
Total diagnoses
Prior risk of death
Lagged CDR (pillar 1)
Age * Sex
Age * Total diagnoses
Age * Prior risk of death
Age * Lagged CDR (pillar 1)
Sex * Total diagnoses
Sex * Prior risk of death
Sex * Lagged CDR (pillar 1)
Total diagnoses * Prior risk of death
Total diagnoses * Lagged CDR (pillar 1)
Prior risk of death * Lagged CDR (pillar 1)
The idea here is to soak up as much variance as possible arising from inequalities in age, background health and progression of viral testing. To my way of thinking the national viral testing regime didn’t so much as detect a genuine “novel and deadly” pathogen as to trigger clinical pathways, protocols and modify behaviours as though there was a novel and deadly virus. In a way Lagged CDR (pillar 1) might be called a groupthink variable, as well as a fear factor, isolation factor, pathway factor and (non) treatment factor. Essentially it is the sum of everything we’ve done wrong, and so we might expect it to figure in any predictive model of clinical outcomes. And, yes, it might also point to something genuine that was going on underneath all of this!
The second stage of modelling was a consideration of the 12 medical conditions as main effects together with the COVID-19 indicator both as a main effect and as an interaction with acute and chronic respiratory conditions, these providing a total of 16 conditional (forward) submissions. Herewith the resulting model structure:
The first three terms are may look a bit odd but all they’re really doing is levelling the playing field for a non-randomised sample: retrospective observational studies of clinical cohorts are so full of bias that it’s hard to tell truth from toffee! We can see that my groupthink-viral variable figures big (p<0.001) in that those two peculiar lockdown weeks coincide with a prior massive splurge in the case detection rate, whatever that may be in real life; the question being just what was being detected and what became of the folk who were told they were positive? But this is not what interests me, what interests me are entries for acute respiratory conditions (p<0.001), other cardiac conditions (p=0.030) and hypertension (p=0.046) so let’s have a look at these in the flesh…
Acute Respiratory condition
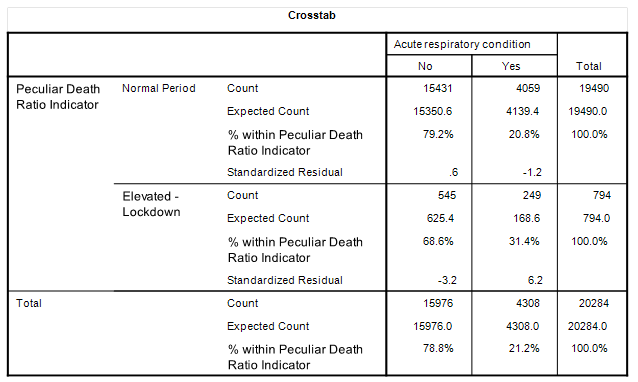
Yep, there it is. During the ‘normal’ period we have an incident rate of 20.8% of adult in-hospital deaths compared to 31.4% during those two peculiar lockdown weeks where the ratio of in-hospital to emergency department death went through the roof.
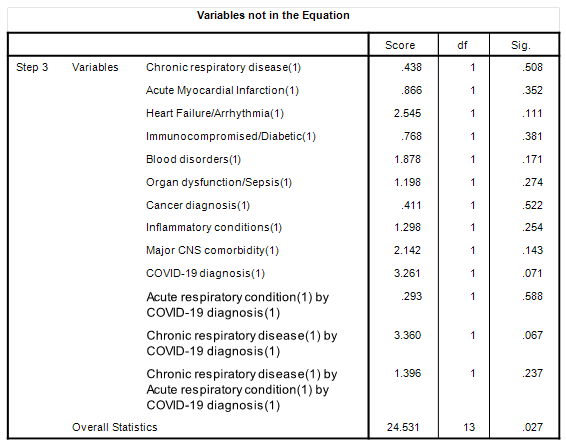
Now before anybody starts shouting COVID! COVID! COVID! Let me remind you that the COVID-19 indicator did not feature as a main effect in the above model and neither did its interaction with acute and chronic respiratory conditions. A bit telling, don’t you think? In case keen readers are wondering what happened to COVID as a predictor of the elevated death ratio herewith a table of independent variables that didn’t make the grade:
Not making the grade means these variables were not associated with an elevated ratio of in-hospital to emergency department death i.e. they weren’t the cause. There’s the COVID main effect sitting there at p=0.071, and there’s the COVID interaction with acute respiratory illness sitting at p=0.558, and there’s the COVID interaction with chronic respiratory illness sitting at p=0.067 (close but no cigar). The cherry on top is the triple whammy interaction sitting with p=0.237.
It ain’t COVID folks, whatever COVID is meant to be.
Some folk may ask why it isn’t COVID in stage 2 of this model when it was that lagged case detection rate (pillar 1) in stage 1. My answer is that in stage 2 we are looking at an individual’s diagnosis prior to their death, and COVID doesn’t actually figure with or without any respiratory complication. In stage 1 we are looking at a national variable that is measuring something that is well beyond the purity of an individual test result; we are looking at the procedural and behavioural response of a terrified nation and scared shitless bunch of healthcare workers as they faced a barrage of inappropriate viral tests that were pretty much designed to give false readings under idiotic cycling thresholds with pathetic sequences subject to cross-contamination. I am tempted to call this variable out as a proxy for the government hype machine. When it comes down to the nitty gritty COVID ain’t nowhere in that model!
So if it wasn’t COVID, then what?
Well, we’re talking about non-COVID respiratory conditions that were onset prior to death. Were these the result of an unknown pathogen? Were these arising from bacterial pneumonia spiralling after antibiotics were withdrawn per protocol? Were these the result of catastrophically inappropriate ventilation? Were these the result of experimental drug trials? Only a thorough study of casenotes will tell but I smell iatrogenesis.
Other Cardiac Conditions
Before we get stuck in I’ll just mention that other cardiac conditions is dominated by chronic ischaemic/atherosclerotic heart disease; namely those poor souls whose arteries are fairly clogged leading to breathlessness (dyspnoea), chest pain (angina), fatigue and all the rest.
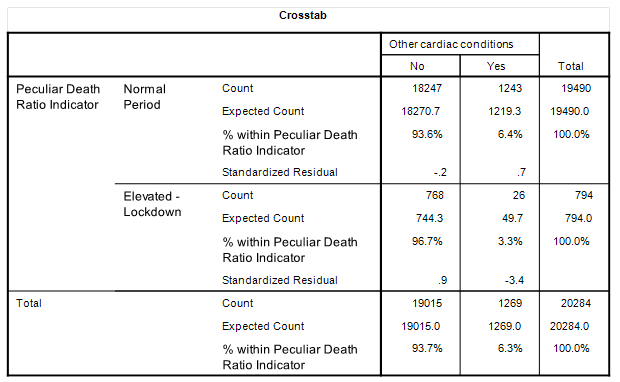
This is a modest term in my staged logistic regression model with an odds ratio (OR) of 0.567 (p=0.030) telling us that folk with these heart issues were less likely to have died during the peculiar two week lockdown period. This runs against intuition but here we see the result in the bare flesh with an incidence rate for ‘normal’ at 6.4% of in-hospital deaths dropping to 3.3% during those two weeks when the in-hospital death to emergency department death ratio rocketed. We’re going to have to cogitate on why this was so.
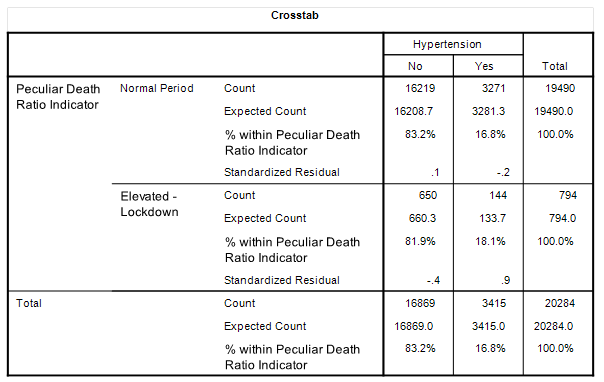
Hypertension
Another modest term in my staged logistic regression model with an odds ratio (OR) of 1.305 just sneaking into statistical significance at p=0.046 telling us that folk with hypertension were more likely to have died during the peculiar two week lockdown period. And here that result is in the flesh with an incidence rate of 16.8% for ‘normal’ and 18.1% for the lockdown period.
The only big potatoes here are those acute respiratory deaths so let us have a look at the post-vaccine peculiarity in the next article…
Kettle On!


